Price Action Trading Module 3 continues
LESSON: Every Chart Has Their Own Trend
It is super important that when identifying a trend you treat each chart independent of each other.
This is a key rule and I would recommend writing it down so you do not forget. If you are trading the daily chart then you analyse and trade the daily chart’s trend. If you are trading the 4hr chart, you analyse and trade the obvious 4hr chart’s trend.
You do not go to the weekly chart and look at it for the trend and look to trade within that trend on the 4hr chart or any other chart.
Every chart has its own trend. One way to think of it is the 4hr chart will have 30 candles form before the weekly candle has one candle form. There could be a couple of different trends on that 4hr chart before one candle has even formed on the weekly chart.
Trying to do multi-chart analysis does not work and only ends with the trader in confusion and on the wrong side of the market. Keep it simple and trade with the obvious trend you can see on the chart you are making the trade on.
See chart for examples
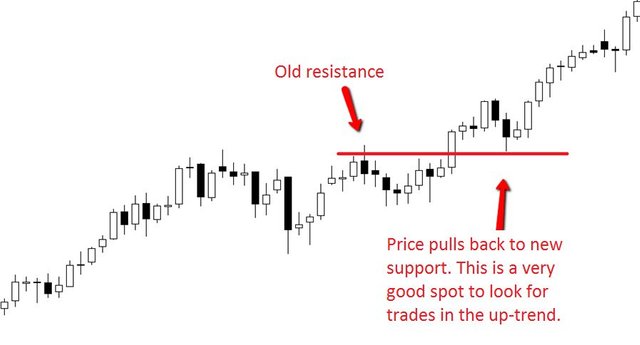
NOTE: This pair is an uptrend. We know now we must look for longs.
Price pulls back to a relevant support level and this is where we would look to go long.
professional_price_action-018
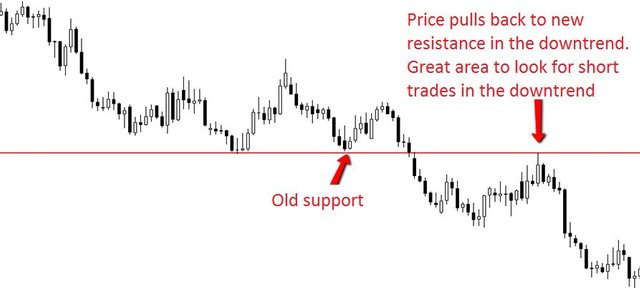
NOTE: This chart is in a down trend.
Price retraces back up to a value area which is also resistance. This is where we would look to short and get into the trend.
professional_price_action-019
You Don't Have to Find a Trend in EVERY Market!
The most common mistake I have found traders to make over the years with trend identification is that they try to find a trend in every pair they are trading.
Always remember this when thinking about trends; the markets range far, far more often than they trend. The nice obvious trends that are really clear don’t always happen on every single chart.
Not every pair you are trading is going to be in a trend and it is far more likely that most of them won’t be. Keep this in mind as you start looking for trends and remember you don’t have to find a trend in every market. Markets can be ranging and they more often than not are.
The trends that traders want to be taking advantage of are the obvious and clear left to right trends that a five year child could point to a screen and say which direction price is moving.
These are the really simple trends where the trader does not have to search and search to work out what the market is doing. It is just really obvious that price is moving up or down.
These are the trends that are by far the easiest for traders to trade and make money in and the trends that members want to start looking for. Once these trends have been found it is just a matter of trading with them using pullbacks into support and resistance such as the chart above.
What Trend Should Members Be Trading Long/Short Term?
There are many trends within the one chart and depending on which the trader decides to trade. The very first thing each trader needs to think about is how long they are looking to trade and how big is their stop and position going to be.
Our particular trading style is swing trading and is suited to trading on the daily charts from anywhere from a day to 5 or so days or possibly more. On the daily charts we could have stops as large as over 100 pips.
Because we trade this way it is super important that we get on the correct side of the next short term swing. It is important that the next swing of 3-10 days in price has us on it.
What is of less importance to us is the long term 6-12 months price cycle.
Compare that to another trader who may make trades on the daily chart and hold them for anywhere from 3-6 weeks and have stops up to 1,000 pips.
This trader would not be fazed in the slightest what goes on in the short term swings or the short term trends of the 3-10 days. This trader would be worried about the trend of the 6-12 month chart.
The problem is you cannot be both traders. Members need to stick to the short term and not the long term because the long term has no impact whatsoever on what is going to happen to their trades and will have them on the wrong side of the market. See charts below for further explanation:
Example Charts:
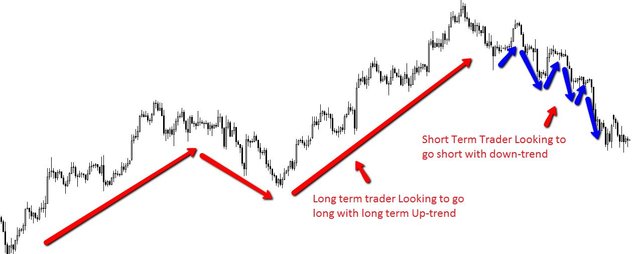
The chart below shows why it is so important to know what trend you are looking for. The trader that is looking for the longer trend would have analysed that there is a long term up-trend in place. This trader would now be looking to get long.
This is not what we want to do. We want to be getting into the short term trend and on the right side of the next swing. The long term trader can sit and hold out for weeks and months and have stops of thousands of pips.
It is very important that we are concentrating on the short term trends and recent momentum.
professional_price_action-020
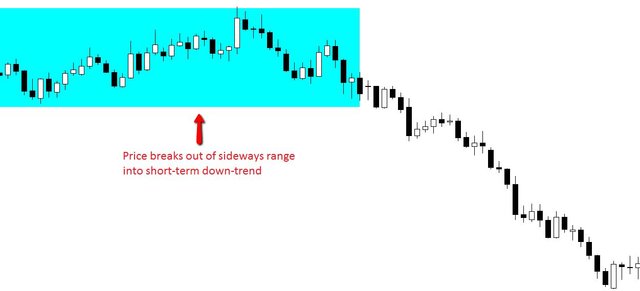
Example of short term trend:
professional_price_action-021
Module Three
Duration: 15 mins
Module Progress:
40% Complete
Next Lesson »
« Previous Lesson