Price Action Trading Module 3 continues
LESSON: 1,2,3 Reversal Pattern
The 1,2,3 reversal is a fantastic way of being able to tell if the market has changed the direction of the short to medium term trend.
As Price Action swing traders we are in a trade for period of 2-6 sessions in most trades. For example a daily trade may be 2-6 days in length. Because of this relatively small amount of time being in a trade we need to try and trade with the short to medium term trend in our favor.
This pattern will allow us to spot when the short term trend and momentum have changed and let us stay on the correct side of the market.
I must make it clear that as swing traders we are not looking to trade with the overall long time trend.
This is of no concern to us because we are not looking to trade with massive stops or for months at a time. We are only in trades for periods of the next swing. For example; we may ride the wave from the swing high to the swing low.
The 1,2,3 Reversal Pattern is called so because it is made up of 3 main movements of price. These movements of price are not just 1 candle but a movement of many candles that create a swing in the market.
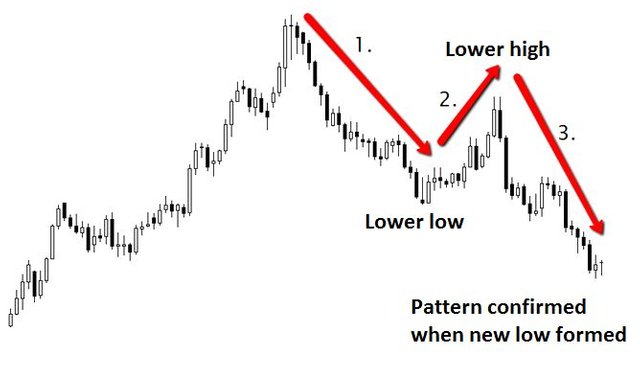
For a bearish trend the 1,2,3 Reversal pattern is made up of:
Price falls lower
Price retraces and creates lower high
Price falls lower again and creates a new lower low
You will notice above I have highlighted the “lower high” and “lower low”. These are vital in identifying this pattern.
These movements of price cannot simply match the recent lows or highs otherwise this would signal the possibility of the market beginning to range. This is a completely different type of market. We need to see price change direction and against the old trend form new levels!
Chart Examples:
In the chart below we have an example of this pattern. Price was in an uptrend.
Whilst this was in an uptrend we were looking to trade long with this momentum on your favor. We can see that from the very high of the uptrend, price first went lower before then retracing and creating a lower high. The pattern was then confirmed when price went lower and created a lower low.
professional_price_action-022
The chart above shows quite clearly the short term momentum has changed from going continually higher to now moving lower. Noticing this pattern change we would look for retraces higher into resistance to get short.
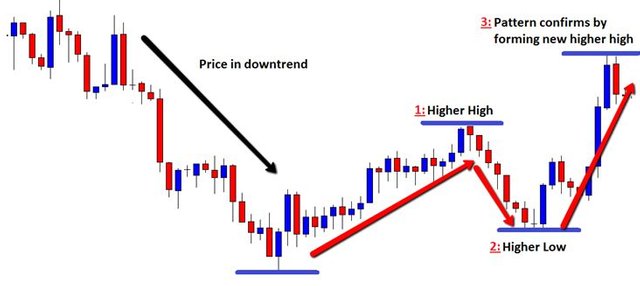
The next example is the same 1,2,3 Reversal pattern but with the trend changing from bearish to bullish.
This chart makes the exact same 3 movements only in reverse.
This chart lets us know the short term trend has changed because it has gone from making lower lows and lower highs to now making higher highs and higher lows.
This indicates to us as Price Action swing traders we need to start looking for longs if we are to trade with the short term momentum in our favor.
professional_price_action-023
Module Three
Duration: 8 mins
Module Progress:
60% Complete
Next Lesson »
« Previous Lesson