China’s Ink Girl a Mass Awakening as Our Sun Changes
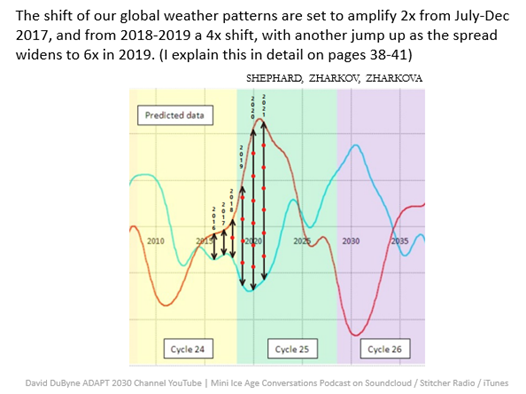
(BELOW) Forecast for you here you of the amplification and intensification in the weather that’s going to continue to cause stresses in crop production because of our new Grand Solar Minimum. We’re already seeing losses globally at the moment, everything from fruit to berries, to grapes, corn, wheat, everything is being affected across all continents. Not an entire continental wipe out, but things are definitely showing signs of damage from extreme weather on the cold end and heat with ferocious winds as Earth’s magnetosphere weakens and our jet streams go out of flow. This is the time line and it’s really interesting how the amplification in the news is following this.

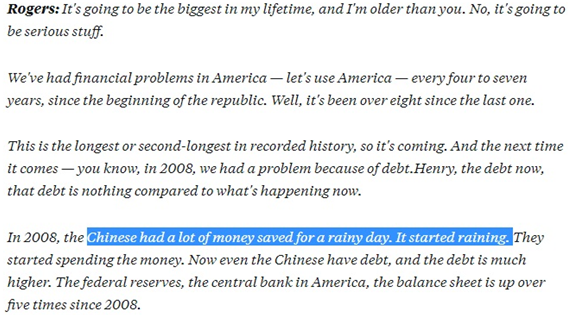
Jim Rogers calling for a crash later this year or next, bubbles is what he’s calling it. Peter Temple from World Cycles Institute as well. It’s all cycles in Civilization.

He referenced the Chinese had a lot of money saved for a rainy day, and it started raining.
Something else had a disruptive force here, shipping, world’s largest shipping company Maersk, collapsing.

When you take a look at the just-in-time delivery system around our planet, China is woven into this so deeply along with the United States and Europe. Everything is intertwined, it includes banking, shipping, the fuel and the letters of credit, all of this has to continue to function to keep the JIT system running.
If there are reductions in crops somewhere along the way, they’re going to try to pick it up elsewhere, pointing case China over in Brazil buying what 53% of their harvest this year. That’s a substitution switch.

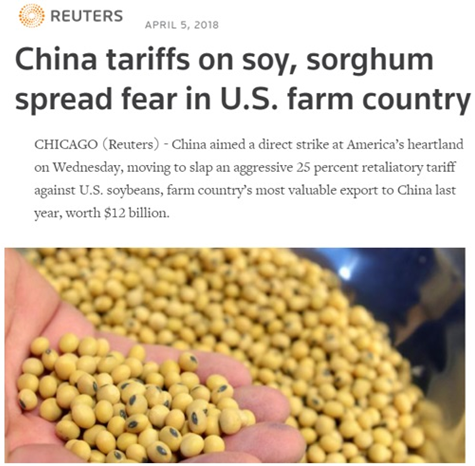
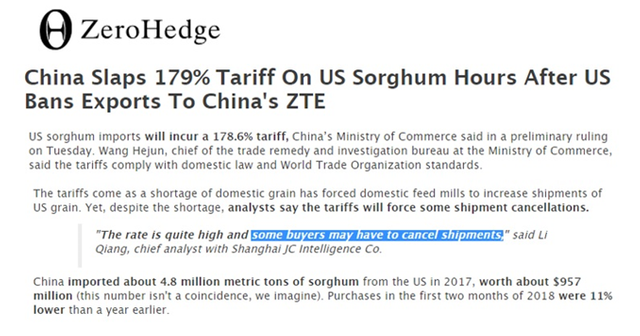
With China implementing this tariff on soy and sorghum coming out of the US, were are they going to get all that additional soybean meal to feed pigs and poultry across China?
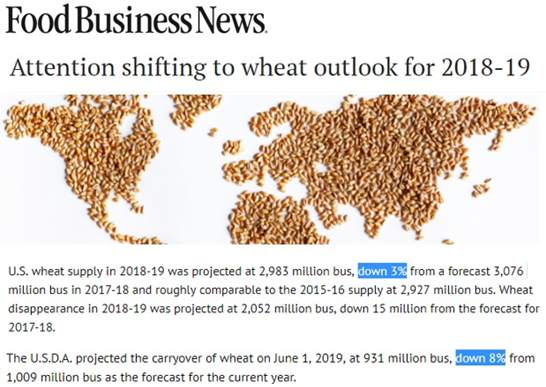
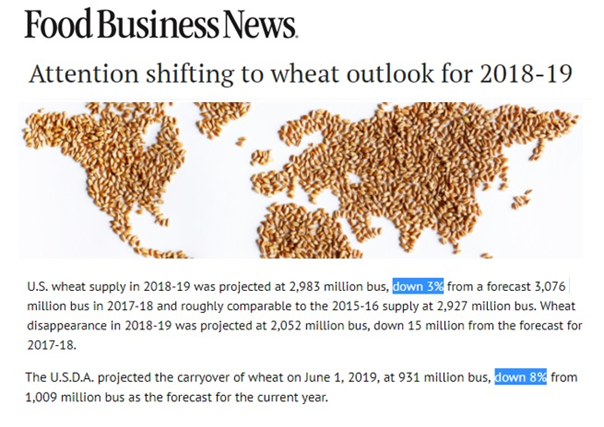
Because of late season blizzards this year, US wheat supply expected down 3%, but the carryover wheat stocks were down 10%.
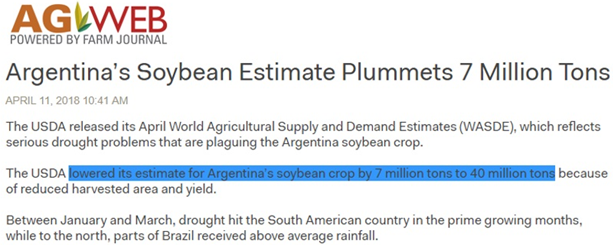
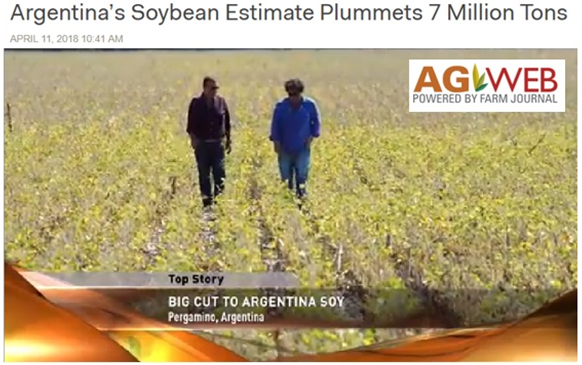
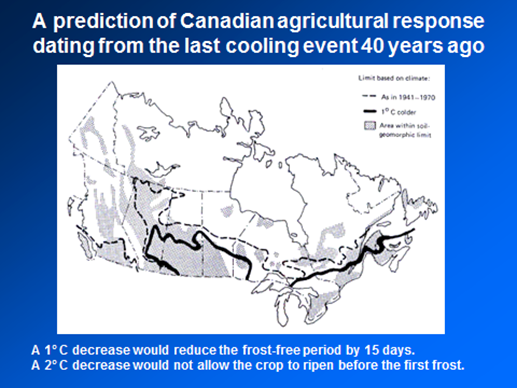
Argentina soybean output plummets seven million tons. If you begin looking at agricultural losses, they are starting on every continent. Importers will now have to think about shifting grow zones, just like China will have to consider this. Canada in North America, even a 1 degree temperature drop will be reduced with its agricultural output to within that dark black line from where it’s grown outside in the periphery areas.
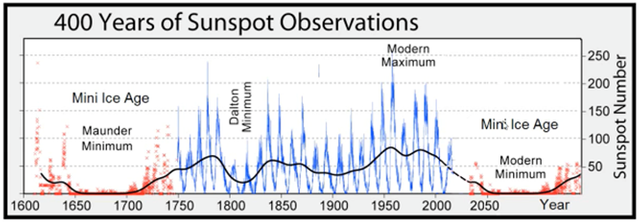
When I say 1 degree Celsius drop we need to look back at the Dalton Minimum, that’s the blue line in the back solar cycles three through solar cycles six (SC3–6) , the red line is where we are currently with our solar activity and solar cycle 24, still tapering out to the regular 11 year Solar Minimum.
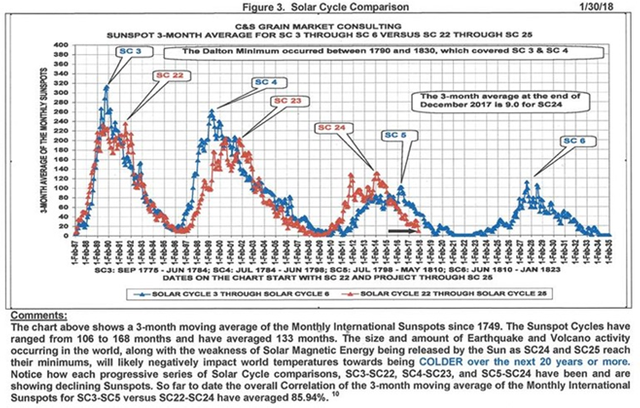
It is expected over these next two solar cycles (SC25–26) that our Sun is going into a Grand Solar Minimum, bringing us back to Dalton or Maunder Minimum temperatures. There were losses in crops that were documented well back through these two minimums.
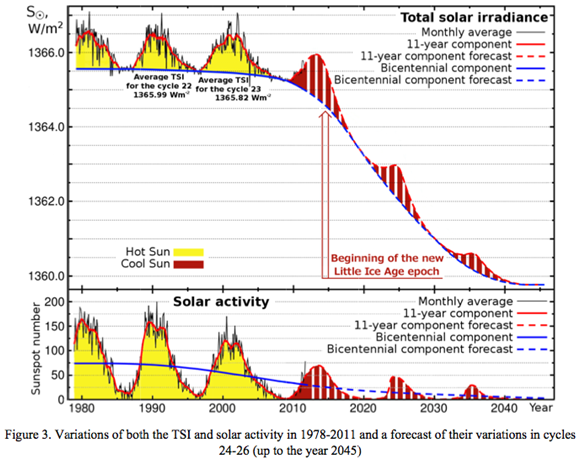
(BELOW) Forecast over SC 25–26 as to the reduced solar activity. This will effect global crop yields, the economy as food prices double or triple and population migration.
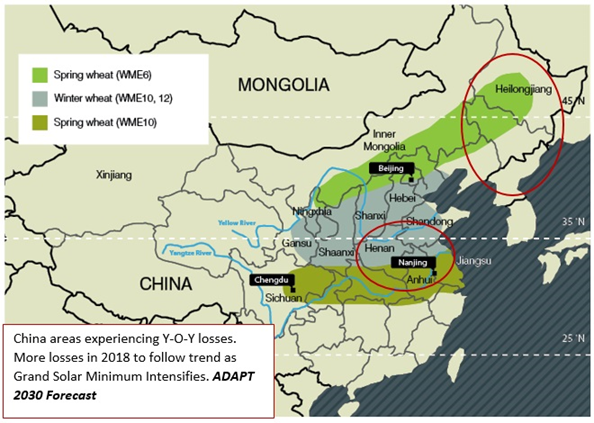
(BELOW) 1 degree Celsius drop means northern China’s Heilongjiang area to grow wheat will go off line beginning with reduced yields. Central Henan area, corn, same, more difficult time growing grains. You can map these cycles back through history and point out exactly where the droughts are going to start.
These are the reconstructed historical droughts going into the Maunder Minimum and also exiting the Maunder Minimum. In the bottom right you see late 1800s, that’s after the Dalton Minimum ended, and you can see where the driest areas occur when we get the Intertropical Convergence Zone moving its moisture patterns.

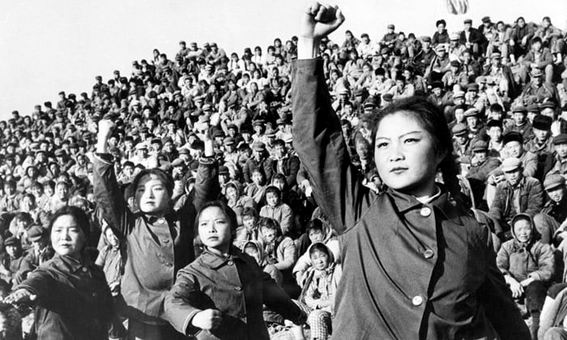
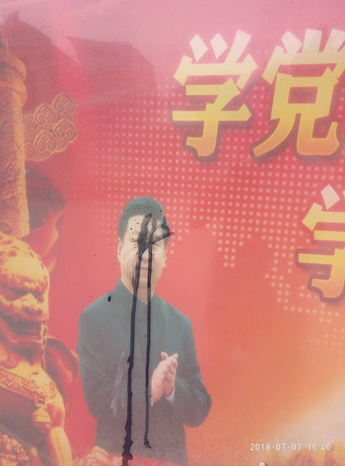
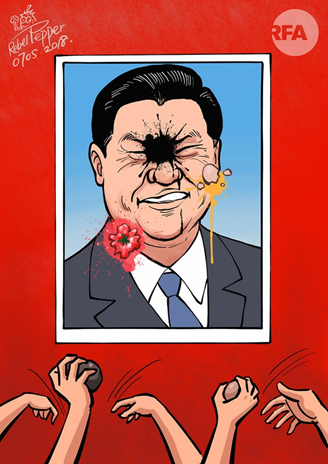
I’m throwing in the wild-card here, because definitely something has flipped and changed in China, the undercurrent of the society in this girl’s aged generation. You would have never expected to see this level of direct confrontation with the Communist Party. I was shocked when I saw this, I thought that is impossible somebody just did this live on Twitter spraying ink on Xi JinPing’s image with ink no less, screaming for government change.


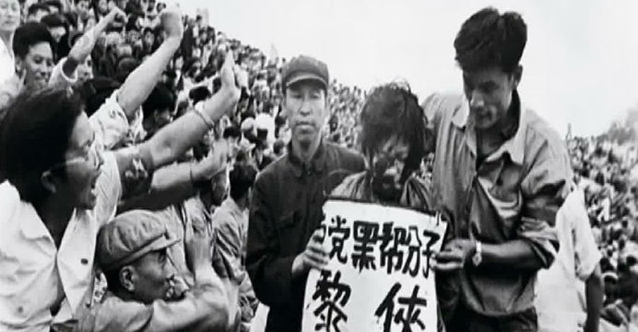
Ink is very important; you have to go back to the Cultural Revolution to understand the significance of ink. Pouring ink on the educated teachers, on the persons with opinions, on the University Professors and embarrass them publicly, they used ink and poured it on their heads.
Here’s the live stream when she walks up to the picture of Xi Jinping on a signboard on the street side and starts saying “Oppose Xi Jinping’s authoritarian tyranny”.

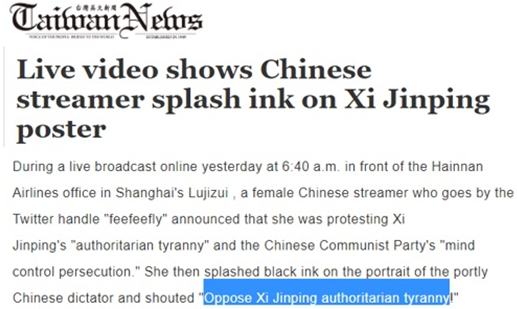
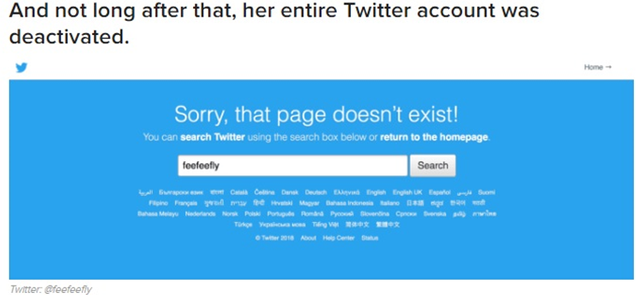
It goes on to say “we have no free speech”, she points to the building behind her and says “I live here come and get me”, I’m waiting for you to come and get me” within eight hours security forces are at her door, she got dressed and headed off with them, nobody’s seen her since.


Her Twitter feeds been closed down, and the only way to access videos are on other websites, I put the links below so you can see the live video of her, what she’s talking about and what she did as a defiant move.
That one single act turned her into a mythical fighter against the dragon.
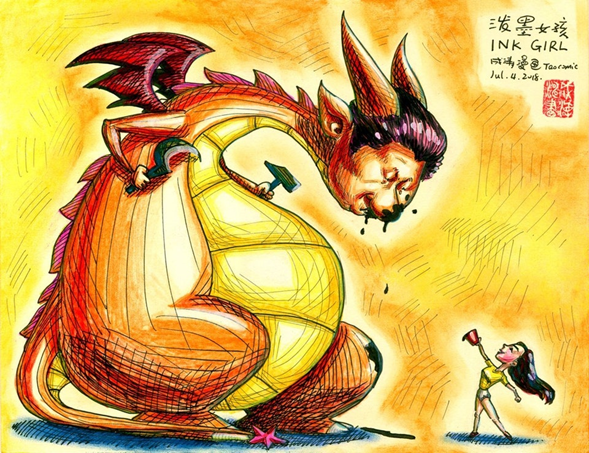
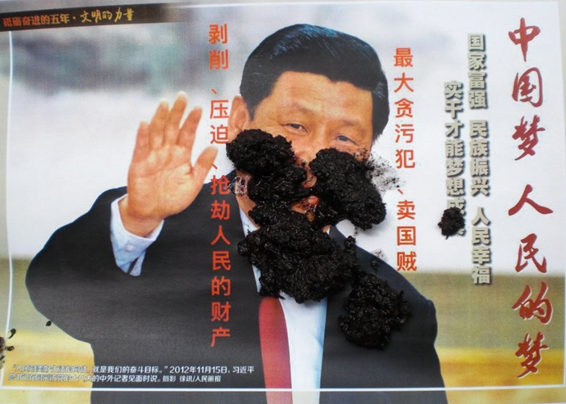
Since that time the inking have become well let’s say common and so many and so unexpected in many places across the country.
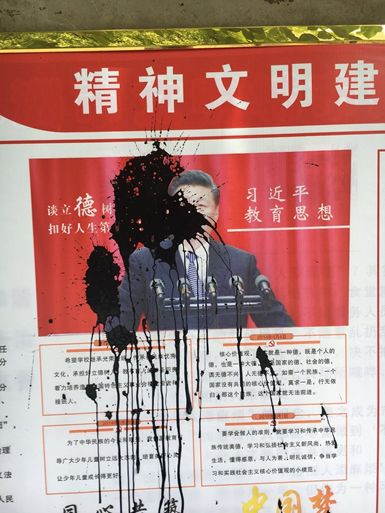
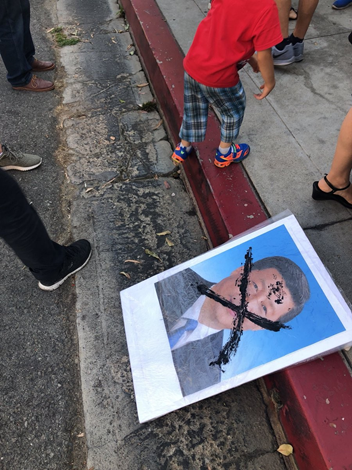
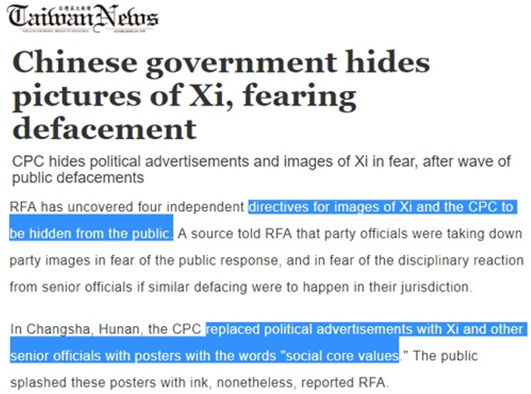
The Communist Party put out directives to remove all images of Xi and all party officials so they could not be inked and so the population could not see that others also think the same and cause an uprising.

They wanted to replace it with “Social Core Values”.
Since they took down the posters immediately within 24 hours, people started targeting buildings. I thought that might be the case too, but on the Beijing Municipal High People’s Court, that’s an undercurrent sign of change coming.
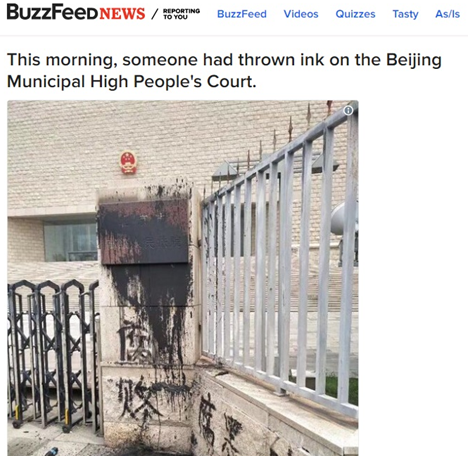
Because when you start to see printed material, “He’s not my president”, that would have gotten you thrown in jail for 20 years in hard labor.
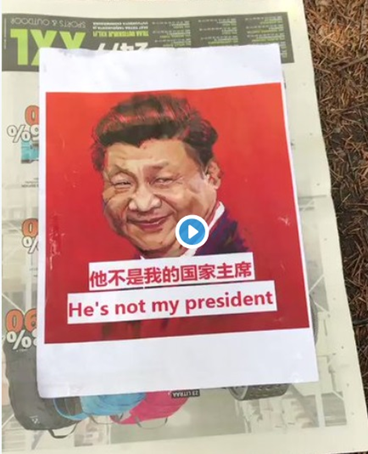
Now these images are coming out as characters and memes.
I don’t know, but my opinion I think the inking, Ink Girl has absolutely started an awakening inside that country of “We need to stand up now because the harsh changes, that are here that are suppressing and limiting any types of online discussions or any thoughts”. Sound familiar?
Those of you in the United States who want to have alternative opinions diminished channels removed or social media deleted because you disagree with their ideas, you just saw what happens.

BuzzFeed has an incredible rundown on this, all compiled in one place.

With all that politics aside over there we’ll put that as (Set A), now I want to mix in (Set B), so you can see how they’re connected. I’ve been stating all along when we come into this more prolonged sunspot less activity, our crops are going to be affected, we’re going to repeat something similar to the Dalton or Maunder Minimum in global temperatures drop and global crop yields will decrease. If yields are decreasing and China needs evermore food, where will they get it because countries are going offline such as United States, Canada, parts of Europe, Russia and China itself going offline in the Northeast.
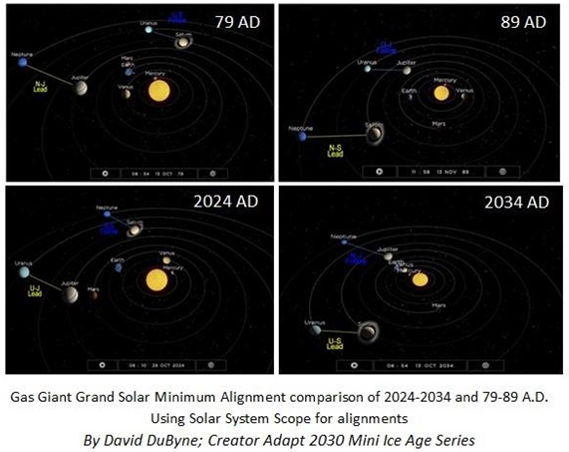
We have to look back at cycles and see how much food, how many grains, what types of grains will be lost? I’m pegging it at something around a once in a 2,000 year event, based on this planetary geometry of when we swing into the more heavier amplification and the cooler point of the Grand Solar Minimum.
The global event is one thing, now bring it down a step where you can find regional areas, and you can map those out with solar activity and how the monsoon, or the Intertropical Convergence Zone is moved north or south, based on pressure systems in the upper atmosphere in these multi century cycles.
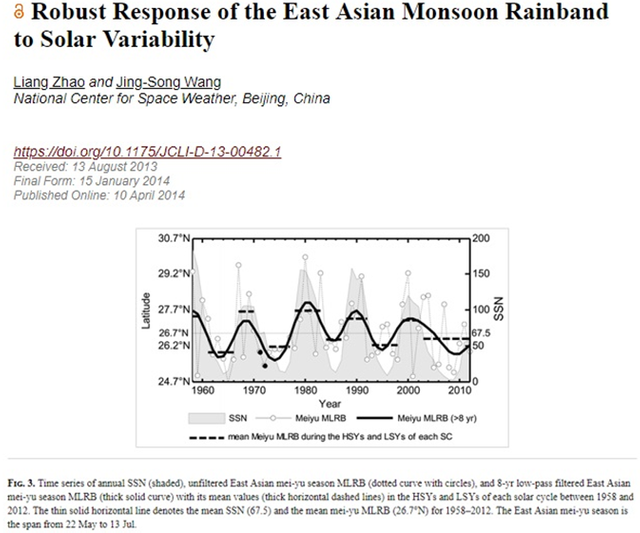
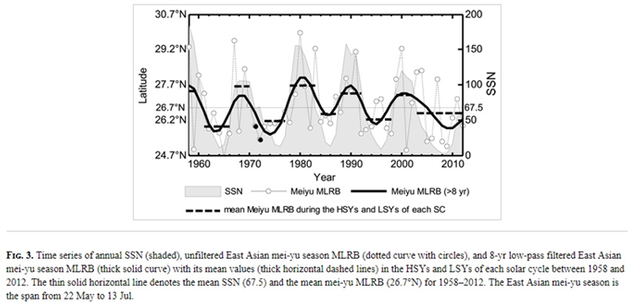
I’ll draw your attention to this chart here, that very light gray is the intensity of the solar cycle, the more sunspots there were, the taller that would be, and that black line smooth through the center is East Asian “Mei Yu” which means rainy season, where it moved north latitude. How far you can see there’s at least a one and a half degree shift there, a hundred miles or so maybe a little more, but coming in to lower solar activity down into a Grand Solar Minimum, where is this going to bring the monsoon at its maximum?
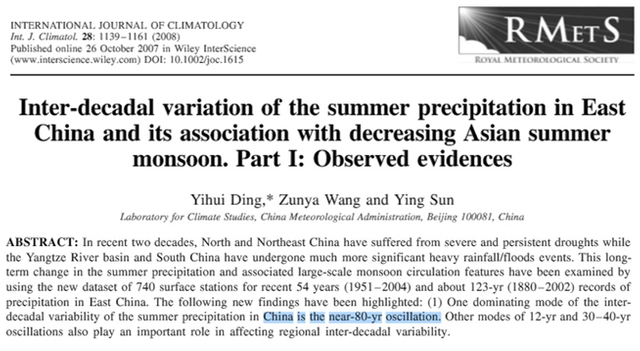
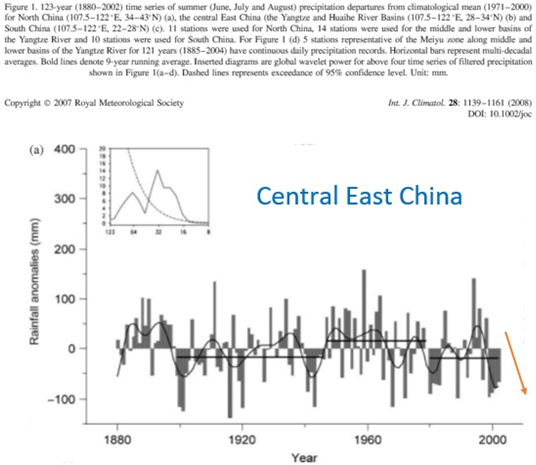
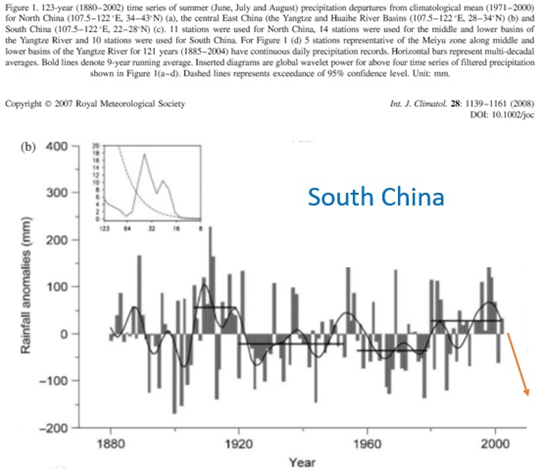
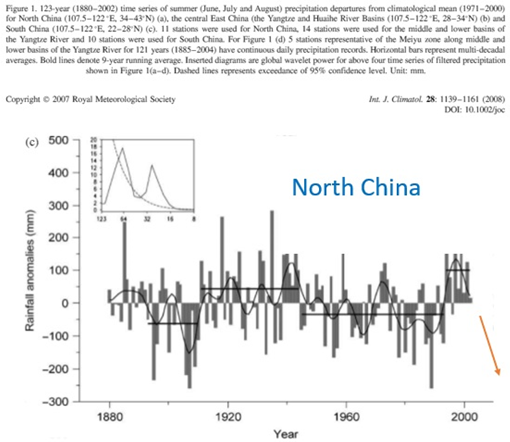
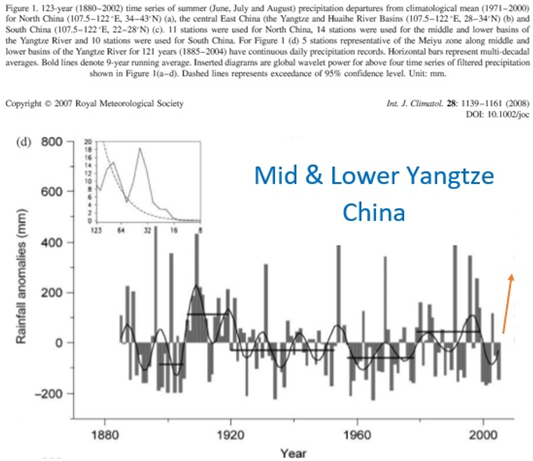
Looking at the Inter-decade Variation of the summer precipitation in East China, this is associated directly with that Asian summer monsoon and has been mapped out since the 1870s it’s in a pattern as well.
The forecast is quite clear; Central East China is going to become drier.
South China, drought as well, this will affect crop yields, decrease in output.
North China, coming into a dry period. Crop yields decreased.
Lower Yangtze is absolutely being inundated with floods, this extra water that they’re getting it’s not steady rainfall, it’s gargantuan once in a two-hundred-year flood type events, now every event.
(BELOW) Looking within the atmosphere, these are the blocking patterns and how these flows in the sky change and also change the rainfall patterns in a Grand Solar Minimum.
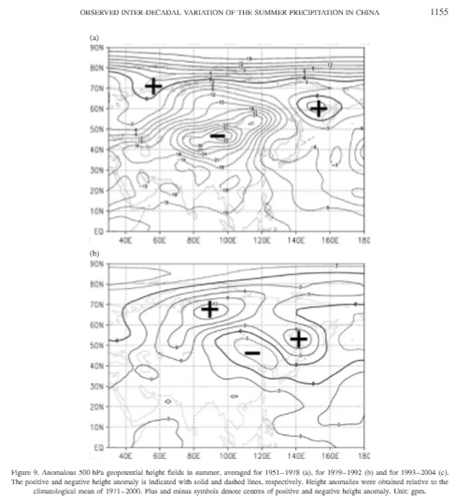
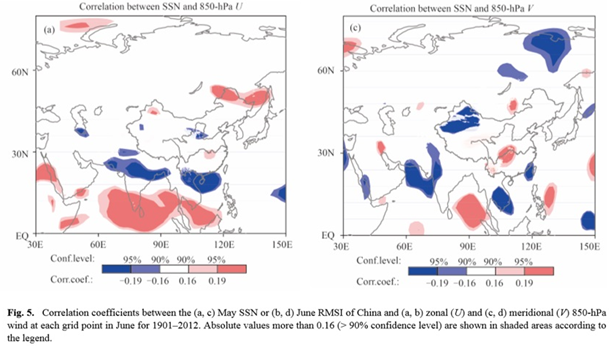
Looking at something black and white with the positive and negative, why don’t we look here with some color and you can see the correlation and the sunspot numbers. May & June for the absolute rainiest season this goes back to 1901, look at the difference in the rainfall comparatively to what the sunspot count is, so what we’re looking for is decreased sunspot activity to map this out. Then you’ll start to think, alright, there’s going to be a drought over in this area.
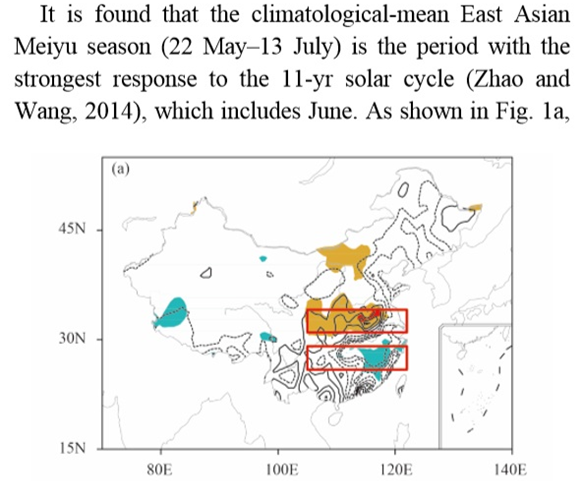
(BELOW) They’ve done an enormous amount of research in the areas that have the red box there, and they found out at the entire year’s seasons, the rainy season is the most affected by the sunspot and solar activity output.
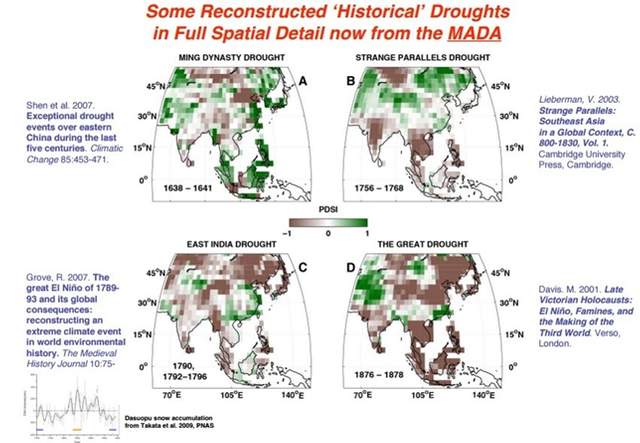
(BELOW) All you have to do is look back in time, where were the sunspots, then where we in the Grand Solar Minimum, what type of solar activity was there at that time? Map out where the droughts were or where it became wetter and cooler, here’s four different time charts for you.
Top Maunder Minimum 1638, 1641, that’s approximately the beginning of the quoted Maunder Minimum, and they exited out approximately 1710. That dark brown up there that is Heilongjiang, that is where they grow an enormous amount of wheat in China. Exiting out of the Grand Solar Minimum looks like that area got more water, but India and Southeast Asia started to dry. It’s also interesting the bottom left when we’re into the Dalton Minimum, that comes up to 1796 but the Dalton Minimum pretty much has a start date around 1810, maybe about 15 years 10 or 15 years after that, so what do we see again incredibly more drought than during the Maunder Minimum.
My analysis shows you can expect these areas to have a very difficult time continuing to grow crops due to reduced rainfall, and colder temperatures.

That would be (Set B) of information. Now let’s add in the final (Set C) and once you blend these three together, you can see it’s very apparent what’s going on with the news feed. How governments are going to start to react to control the citizens when food prices rise?
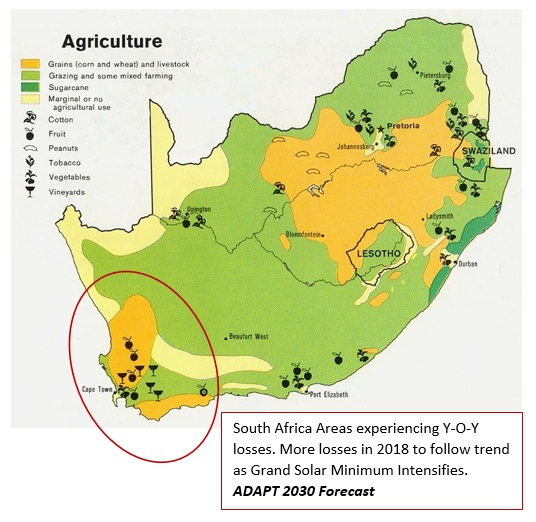
Let’s take a look elsewhere where wheat is being grown that’s going offline with reduced yields, South Africa they’re a major producer and exporter up to the rest of Africa. If African buyers are drawing from somewhere else because they can’t import from from South Africa, they’re going to pull from somebody else’s stock, but China is going to be trying to pull from somebody else’s output as well.
(BELOW) These areas across North America and especially in Nova Scotia, which I didn’t circle had some late season freezes. These three areas are showing extreme stress, and you’ll understand why the US wheat crop is down in that central Nebraska area.

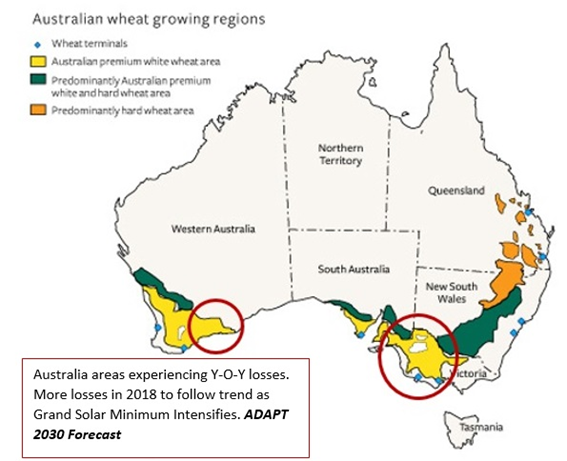
Areas here in Australia also losing wheat production due to drought.
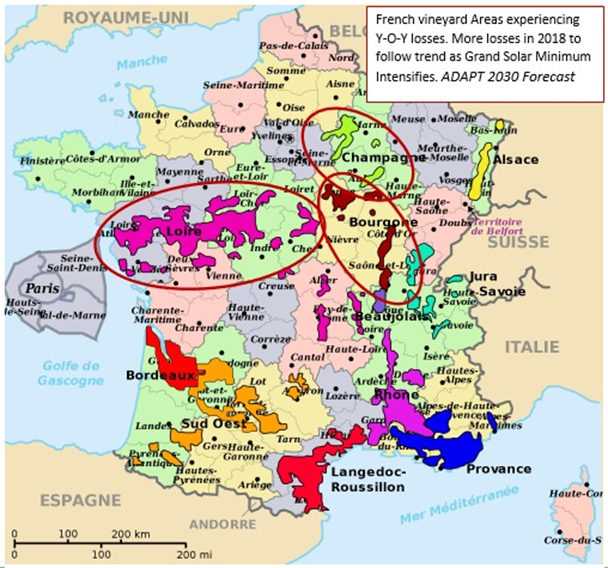
France is losing everything, Vineyards, berries, wheat, it is a non-stop flood and weather events happening over there. Germany as well, so these two producers in Europe showing signs of decreased yield.
That takes us right into this inner woven just-in-time (JOT) delivery system that all revolves on credit first, and then things move after, because there’s a guarantee of payment.
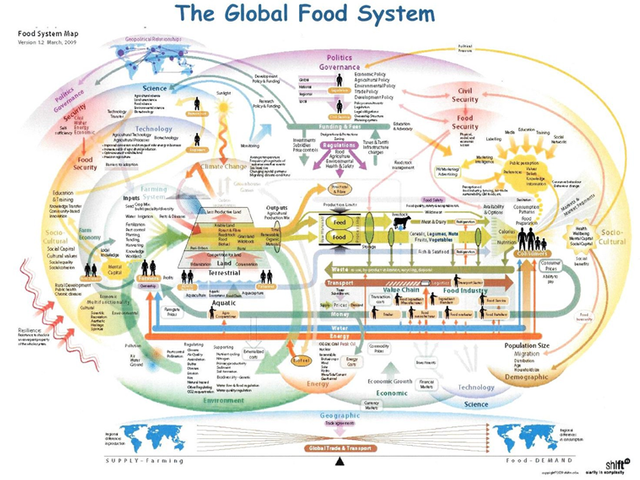
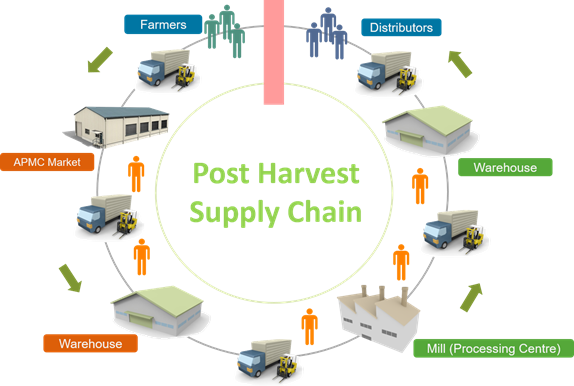
(BELOW) Historically a country’s harvest is its true GDP, because without the food everything else ceases. How many breaks could happen in this just-in-time delivery system, I mean this is the global food system alone, this is not electronics this is just your food source.
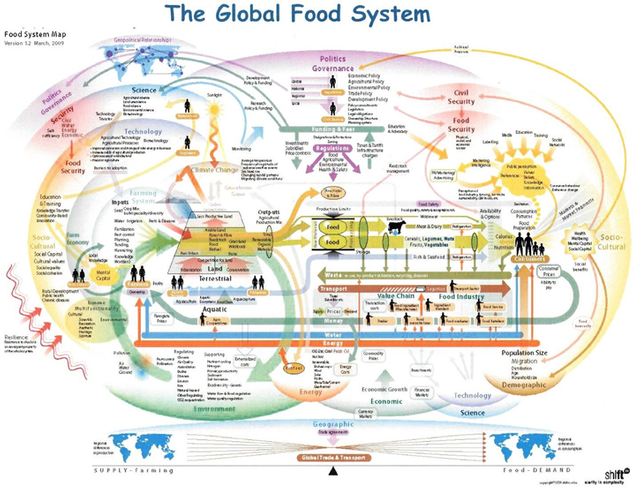
Think about yourself, how the post-harvest supply chain has to move through this many hands to go from the farmer to the distributors and then once it’s to the distributors it needs to get moved by shipping companies back to that other slide (ABOVE).
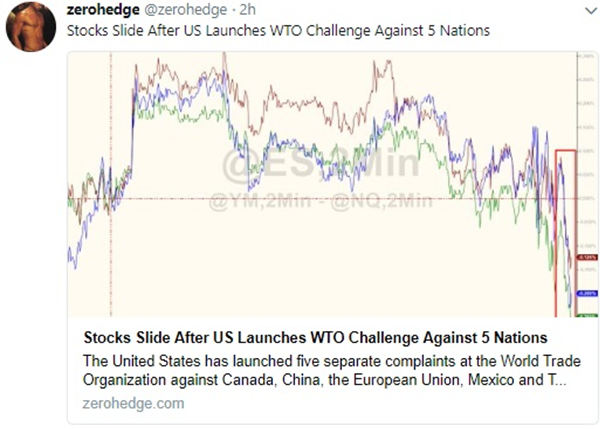
There’s so many things going on now, we got these World Trade Organization (WTO) challenges against five different nations launched by the US.
US wheat production is expected down three percent or more.
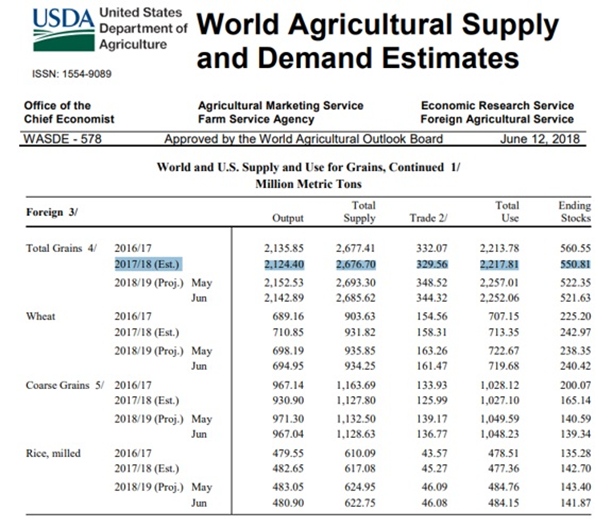
With the world wheat consumption at a record up 1.6 percent, and then you jump over to inconvenient statistics like this “total grains” forecast by the United States Department of Agriculture (USDA) which forecasts a drop of 40 million tons in the carryover stocks. Top entry there, “total grains”. If they’re already forecasting out decreases and in the carry over somebody pulled 40 million tons out, where’s that going to take us over the next three four five years as China continues to go offline, with all these other countries as well?
It’s going to be a lot of people seeking out alternative food sources or substitution crops.
Then you see China slapping 179 percent tariff on sorghum. I just don’t get it why China is doing this with the sorghum play when they need feed for their animals, soy too.
I want to wind this back into Ink Girl again. This is a greater movement inside Chinese society, her generation has a lot of problems to contend with trying to find jobs, housing is too expensive, the job markets completely saturated. Everybody’s continually going to school because they can’t find jobs, you got people with PhDs that can’t find work, millions and millions of people with master’s degree that can’t find work, things are becoming quite unaffordable, and now you’re going to throw in doubling or tripling food prices.
This is why I see something that’s connecting with the Grand Solar Minimum and when the Chinese are going to take action when their food prices rise.

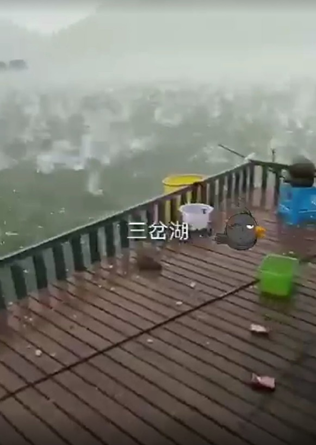
Case in point, I had one of my viewers send me these images and said David I want to remain anonymous, because in China you’re not allowed to report on the news. If you blog about weather events, that’s illegal now. Only State Run Media can report weather damage.
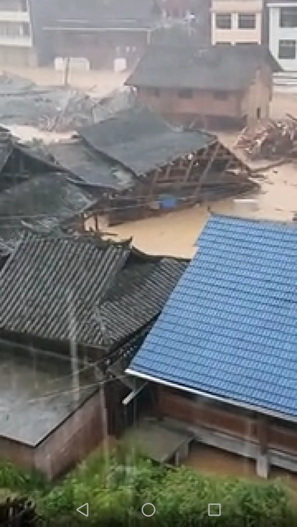
This is July 1st, Sanchahu, and then July 2nd in Liu-Jiang.
These are floods that destroyed Liu-Jiang old town, and unreported within the greater Chinese media. They don’t want to cause panic because every rain event is a once in a 200-year event with homes and buildings washed away.

Just think how all these events are intertwining right now with the timeline of the Grand Solar Minimum.
Thanks for reading, if you have any ideas or thoughts on how the layout is either through Medium or Steemit, please send me a message on how to present the most value in that written form, because I know some people like to read verses watching the video.
*** Today’s Story Links ***
Live ink splashing video banned in China blob:
https://www.voachinese.com/e163d6f6-3...
Live ink splashing video banned in China https://twitter.com/twitter/statuses/...
Live video shows Chinese streamer splash ink on Xi Jinping poster https://www.taiwannews.com.tw/en/news...
Disappearance of ‘Ink Girl’ in China spurs others to deface Xi Jinping images https://www.taiwannews.com.tw/en/news...
Chinese government hides pictures of Xi, fearing defacement https://www.taiwannews.com.tw/en/news...
Zerohedge Twitter https://twitter.com/zerohedge/status/...
This Woman Threw Ink On A Photo Of China’s President On A Livestream And Now She’s Disappeared https://www.buzzfeed.com/kassycho/chi... https://www.hongkongfp.com/2018/07/14...
JIM ROGERS: The worst crash in our lifetime is coming http://www.businessinsider.com/jim-ro...
July 1st, San-Cha-Hu hail and and July 2nd 2018 Liu-Jiang Flood destroying Liu-Jiang old town, China

*** ADAPT 2030 Social Media Links ***
1.) PATREON www.patreon.com/adapt2030
2.) BITCHUTE https://www.bitchute.com/hashtag/adapt2030/
3.) STEEM https://steemit.com/@adapt2030
4.) *** ADAPT 2030 True Leaf Market Link ***
5.) Mini Ice Age Conversations Podcast
Libsyn: http://adapt2030.libsyn.com/
iTunes: https://itunes.apple.com/us/podcast/adapt-2030-mini-ice-age-conversations/id1200142326
6.) FB https://www.facebook.com/Miniiceage
7.) TWITTER https://twitter.com/adapt2030
8.) YOUTUBE www.youtube.com/user/MyanmarLiving

9.) MEDIUM https://medium.com/@globalcooling
Congratulations @adapt2030! You have received a personal award!
Click on the badge to view your Board of Honor.
Do not miss the last post from @steemitboard:
SteemitBoard and the Veterans on Steemit - The First Community Badge.
You have to market yourself more on Steem David, great analysis! Can I buy your book with crypto?