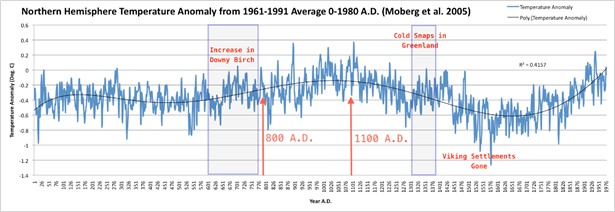
Global Temperatures When Notre Dame Was Built
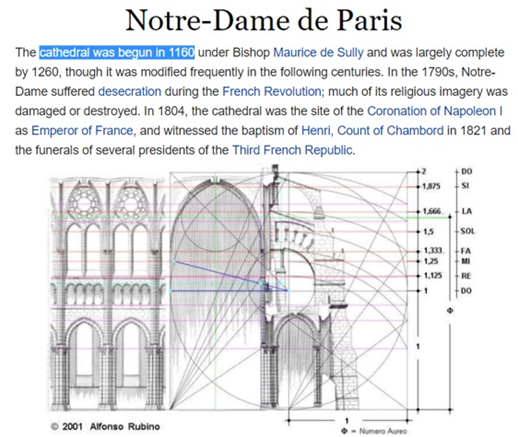
The chart below is from the Greenland Ice Core data set or the GISP (Greenland Ice Survey Project), showing the Northern Hemisphere Temperatures for the last 2000 years. The IPCC loves to say that global temperatures are warmer than ever, but what do you notice in the graph? That spike at the beginning of the construction of the Notre Dame Cathedral shows that agriculture was at a high point. There was an abundance of food, so people could focus on other things such as art, music, and architecture. They are not too worried about the day-to-day struggles to stay alive, as in the Dark Ages, when they had a very difficult time growing food.
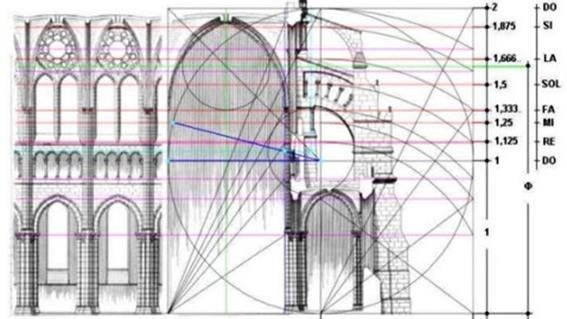
For example, look at the sacred geometry inside Notre Dame. The concepts behind this was based on the Fibonacci sequence and other numerology, if you are into this topic. So again, creativity increased among the people because they had more time to focus on other things than just filling their belly to stay alive.
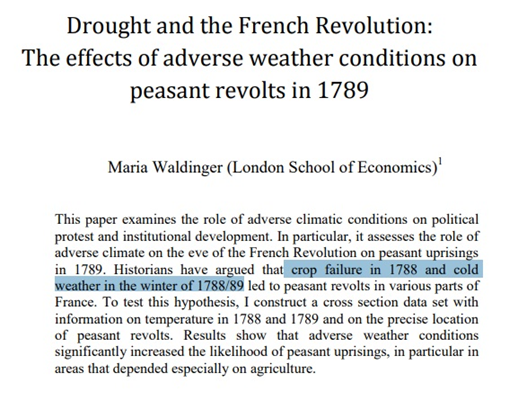
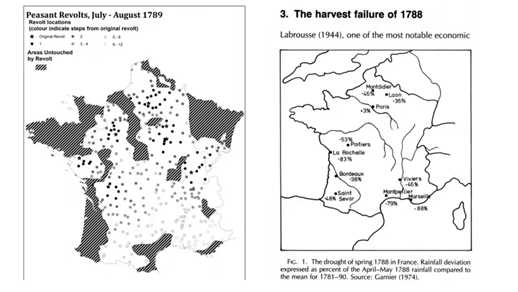
If we fast-forward to the French Revolution, droughts took place and the adverse weather conditions led to peasants’ revolts in 1789. It was said that the full-on crop failure in 1788 and the subsequent cold sparked the revolution. They did not really talk about the oppression of the serfs at the time, but I am sure something like that added to the volatility of the time. They were downtrodden, especially when they did not have food. That was not a very nice mix for the rulers. Anyway, we are starting to see the same thing again, some sort of upheaval observed everywhere you look across the planet.
This is an incredibly interesting proxy shown in the chart, the peasant revolt from July to August 1799. The stars in the map point to where the riots and the revolts started. Some of these areas are the very same areas that suffered from vineyards wiped out and wheat production losses due to hailstorms over the last two years.
The matchup in history is startling and a little bit spooky, as shown on the left side of the map. If we transit over to the right side, harvest failure records are shown. Those numbers represent the below normal percentages for moisture content, or literally how much less rain there was.
So, some places were only receiving half the yearly rainfall. Remember back then, they did not have the irrigation systems as we do today. There was no just-in-time delivery either. So, if their crops failed, they starved. They could not buy those or deliver those from somewhere else a long distance away. Also, the water flow system and other modern agriculture techniques we have now blew away anything that they had during that time.
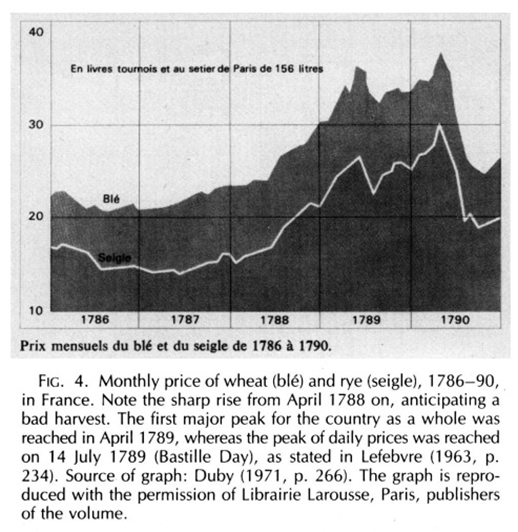
With that being said, this is the most important chart of the article: The food price increases during bad harvest years. Something similar to this was seen in Germany where food prices increased 3x. So, as you can see, there was a very quick tripling of prices for three years from 1786. I am laying out this information shown in this graph for you, because I feel that 2019 is the beginning year. Just switch this to 1786 and over the next 5 years, our food prices are absolutely going to increase due to crop losses brought by extreme weather conditions that we will experience, because of the intensification of the Grand Solar Minimum.
Whether these are from some solar physicists or not, or whether you believe that it is culminating or not, the weather signs are all around us. We are losing crops. What do you think will happen in five years? If food prices are tripled, do you think our global economy will stay intact? Absolutely not. These are some of the things that accompany a Grand Solar Minimum: population reduction, contraction in the economy, and population migration among others.
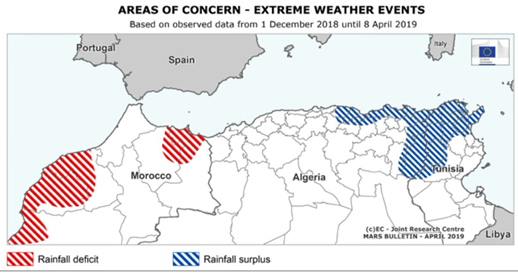
Now, since Europe is pretty close, we should take a look at Areas of Concern-Extreme Weather Events. As shown, Morocco is experiencing droughts, whereas Tunisia and parts of Algeria are having rainfall surpluses. This explains the record snows across Algeria for the last two years.
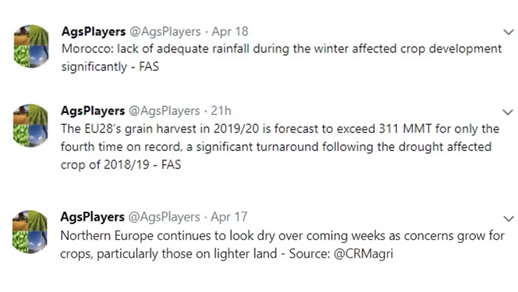
From AGsPlayers, Morocco lacks adequate rainfall, so crop development is impaired significantly, but what I really like is the diametrical opposite information flowing through the media. For example, look at this, EU grain harvest 2019–2020 forecast to exceed 311 million tons for only the fourth time on record, a significant turnaround following the drought affected areas of 2018–2019. Yet in the very next set of tweets, it says, Northern Europe continues to look dry over the coming weeks as concerns grow for crops, particularly those on lighter land.
There is absolutely a significant cover-up going on to keep you thinking that everything is stable and that nothing is changing; that is why we are seeing these diametrically opposite headlines. You really need to mark these times, follow them forward and you will observe that if their forecast does not come out correctly, they will say, “It was just a forecast”. Things could change with a rosy forecast.
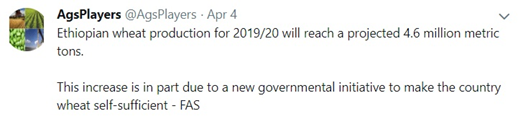
Also, Ethiopian wheat production for 2019–2020 will reach 4.6 million metric tons with the increased natural rainfall in northern Africa which accompanies multi-millennia shifts in climate. This is not just a 400-year shifts, but literally a 2,000- or 3,600- or 6,000- year shift. We are back at it and again, but the government is still pushing self-sufficient wheat. They got the rainfall now; they can surely do it.
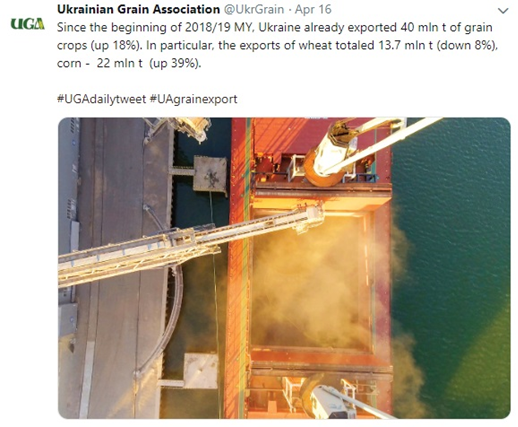
Then look at Ukraine, the breadbasket of Central Europe. Wheat is down by 8% in production, but corn is up 22%.
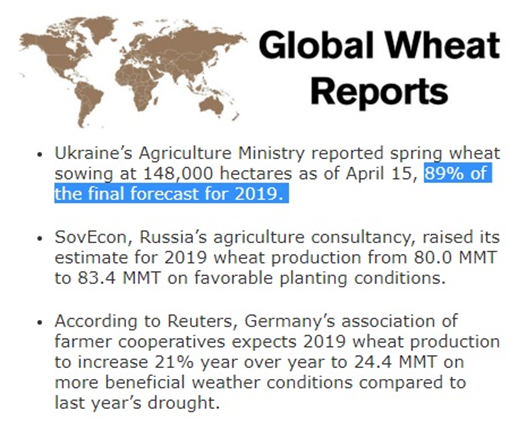
This followed right on the heels of the Global Wheat Report: Ukraine Agriculture Ministry reports that the spring wheat has been sown up to 89% of the final forecast. So again, it fell short on what was in the forecast. Also, the Russian agricultural consultant says that Russia could increase its production this year, but the extreme weather that is happening right now in the Ural Mountains is definitely going to put a dent into that.
Let me bring you to the last paragraph. According to Reuters, Germany’s association of farmer cooperatives expects 2019 winter wheat to increase 21%. An increase of 21%?! Really. Where will that come from? That much land cannot just be allocated to increase. Are “experts” sure they are going to come straight out of the drought, or this is just an alleviation during the springtime? Nobody is sure, but follow the last 3 to 4 years and it may dry out as soon as it gets towards later spring if it follows the pattern over the last 4 years, they are going to go right back to the drought season.
Everything looks good on the headlines though. It assures the markets. It has always been about assuring everybody that everything is stable, that nothing will change.
This is an important message that you should take seriously: It is really going to change, when they are saying it is not going to change, you need to be looking 180 degrees behind everything that is being told. If stability is the headline of the day, you should be looking at the other direction to see where the instability will come from.
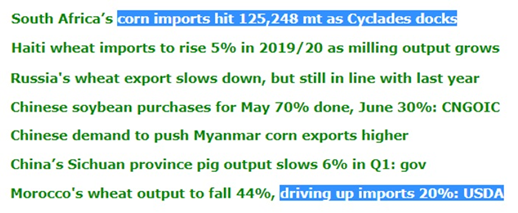
Take a look at some of these headlines as well. South Africa’s corn imports hit 125 million metric tons. This is because they cannot grow corn there anymore. The farms there were confiscated and please note that South Africa used to export, but now they are importing, which is a complete flip. Russia’s wheat exports slow down. This has been the name of the game for the last several months of headlines about Russian exports. Russia is not going to export as much wheat, so even if they grow extra, they will not export it. So, who cares if they increase 3 million tons, when it is staying in Russia anyway? Now, here is a good one. Chinese demand to push Myanmar corn exports higher. Remember that the African swine fever is running amok in China. As for Myanmar, it used to be the breadbasket of Asia, and I am wondering if that is going to help China to bring more of their agriculture online. Everywhere you look, China is scarfing up any type of extra supply across the planet. Sichuan province Pig output slows 6%. And, Morocco’s wheat output to fall 44%. That goes right back to that stress chart.
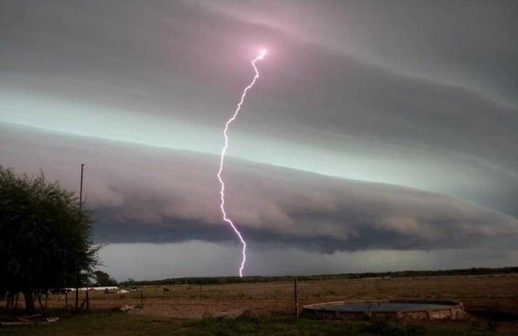
Finally, I want to leave you with this image of a double shelf cloud plasma display, otherwise known as pink lightning in Central Europe.
Thanks for reading, I hope you got something out of the article. If you like more information like this I produce the tri-weekly Mini Ice Age Conversations podcast, 30 minutes of in-depth analysis on the GSM you can take on the go.
Mini Ice Age Conversations Podcast
iTunes: https://itunes.apple.com/us/podcast/adapt2030
Soundcloud https://soundcloud.com/adapt-2030
Libsyn http://adapt2030.libsyn.com/
(MIAC #201) The Importance Shift, If People Don’t Have Food They Won’t Need Energy
For the bi-weekly Grand Solar Minimum climate update newsletter from myself, David DuByne, (ADAPT 2030) jump over to oilseedcrops.org you can enter your email and sign up. Move your mouse around for about 10 seconds and this box will pop up.
Join ADAPT 2030 NEWSLETTER http://www.oilseedcrops.org
“Help support the adapt 2030 channel on brighteon so we can keep Grand Solar Minimum information free to access.”
https://www.brighteon.com/channel/adapt2030
Support ADAPT 2030 by Visiting Our Sponsors
ADAPT 2030 & My Patriot Supply 2-Week Food Supply with 92 servings
www.preparewithadapt2030.com
True Leaf Market Heirloom Seeds ADAPT 2030 True Leaf Market Link
ADAPT 2030 Amazon Grand Solar Minimum Book Store https://www.amazon.com/shop/adapt2030
Upheaval: Why Catastrophic Earthquakes Will Soon Strike the United States https://amzn.to/2E7KbBt
*** Today’s Story Links ***
Notre Dame Construction information
https://en.wikipedia.org/wiki/Notre-Dame_de_Paris
Drought and the French Revolution: The effects of adverse weather conditions on peasant revolts in 1789 https://personal.lse.ac.uk/fleischh/drought%20and%20the%20french%20revolution.pdf
Great Historical Events that were Significantly Affected by the Weather: Part 9, the Year Leading to the Revolution of 1789 in France (II), Neumann and Dettwiller https://journals.ametsoc.org/doi/pdf/10.1175/1520-0477%281990%29071%3C0033%3AGHETWS%3E2.0.CO%3B2
Witch Trials: Discontent in Early Modern Europe http://repec.graduateinstitute.ch/pdfs/Working_papers/HEIDWP11-2016.pdf
*** ADAPT 2030 Social Media Links ***
PATREON https://www.patreon.com/adapt2030
YOUTUBE ADAPT 2030 Mini Ice Age 2015–2035 Series on YouTube
BITCHUTE https://www.bitchute.com/hashtag/adapt2030/
BRIGHTEON https://www.brighteon.com/channel/adapt2030
STEEM https://steemit.com/@adapt2030
MINDS https://minds.com/ADAPT2030
MEDIUM https://medium.com/@globalcooling
FB https://www.facebook.com/Miniiceage
TWITTER https://twitter.com/adapt2030
Is very good thank you so much i like it.😊
Posted using Partiko Android