Stellar price analysis: RSI signals bullish
Stellar price analysis: RSI signals bullish divergence for XLM, will it play out?
The XLM bulls are trying to come up with price action, though the market has turned out to be neutral at the moment.
by Michael Fasogbon July 31, 2019 2 min read
Stellar
Credit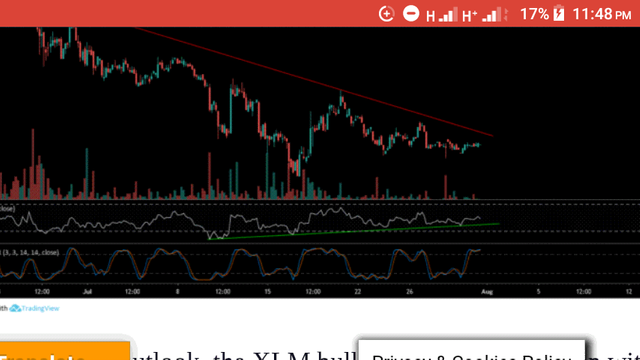 : Pixabay
TronEurope paid advertisement TronWeekly
ADVERTISEMENT
Stellar bulls are finding it challenging to break above the five weeks falling trend line (red) as the $0.089 remains a severe level for the token.
With the choppy outlook on the daily chart, the XLM bears are still in charge of the market on a long-term.
Despite the mid-term bearish flow, the technical RSI indicator keeps bullish momentum on the 4-hours as price hovers around $0.084.
Over the past week, there’s been no much price action evolving around the Stellar market, but the trading volume has drastically appreciated by $60 billion-plus under 24-hour of trading. Still, Stellar’s price is yet to make a significant move.
However, the market may suddenly turn positive if such huge volumes continue to reveal in the market statistics. The technical RSI indicator has also shown three-weeks higher highs and higher lows. We can expect the XLM price to spike in the coming days.
Stellar’s Current Statistics
Trading Price: $0.085
Market Capitalization: $1,648,810,716
Trading Volume: $94,811,472
Key Resistance Levels: $0.089, $0.96, $0.10
Key Support Levels: $0.080, $0.076, $0.070
Stellar Price Analysis for July 31, 2019
On the 4-hour chart, the XLM/USD pair has been recently subdued with choppy price actions due to inactive trade which has made the market to appear boring over the week. In fact, the chart volume has significantly faded away quickly as a result of selling pressure in the market.
Stellar (XLM) is once again trading near the descending trend line following the $0.080 rebound on July 27. If the market can manage to break out this time, the token may swing high to the $0.089, $0.96 and $0.10 resistances.
On the hourly outlook, the XLM bulls are trying to come up with price action, though the market has turned out to be neutral at the moment. On the other hand, a bearish step back could slip the price to $0.080, $0.076, and $0.070, which has remained the technical support levels, as mentioned in our previous Stellar’s analysis.
Conclusively:
Looking at the price chart, we can see that $0.080 level has remained critical support since July 24. If the support can further hold firmly, we may see a steady rise up in the next few days. Meanwhile, the price range is still much close to the current price at around $0.085. There’s a need for more price increase before we can consider $0.080 a reliable support for the market.
Technical Indicator Reading
While maintaining the green trend line, RSI for Stellar has turned positive despite the downward movement on the price chart. As we have said in our previous analysis, the technical indicator is playing a bullish divergence move.
Inversely, Stochastic RSI is revealed at the overbought condition, suggesting a potential price fall for the market.
Disclaimer: The presented information is subjected to market condition and may include the very own opinion of the author. Please do your ‘very own’ market research before making any investment in cryptocurrencies. Neither the writer nor the publication (TronWeekly.com) holds any responsibility for your financial loss.