Btc Update
🚨 EMERGENCY UPDATE 🚨
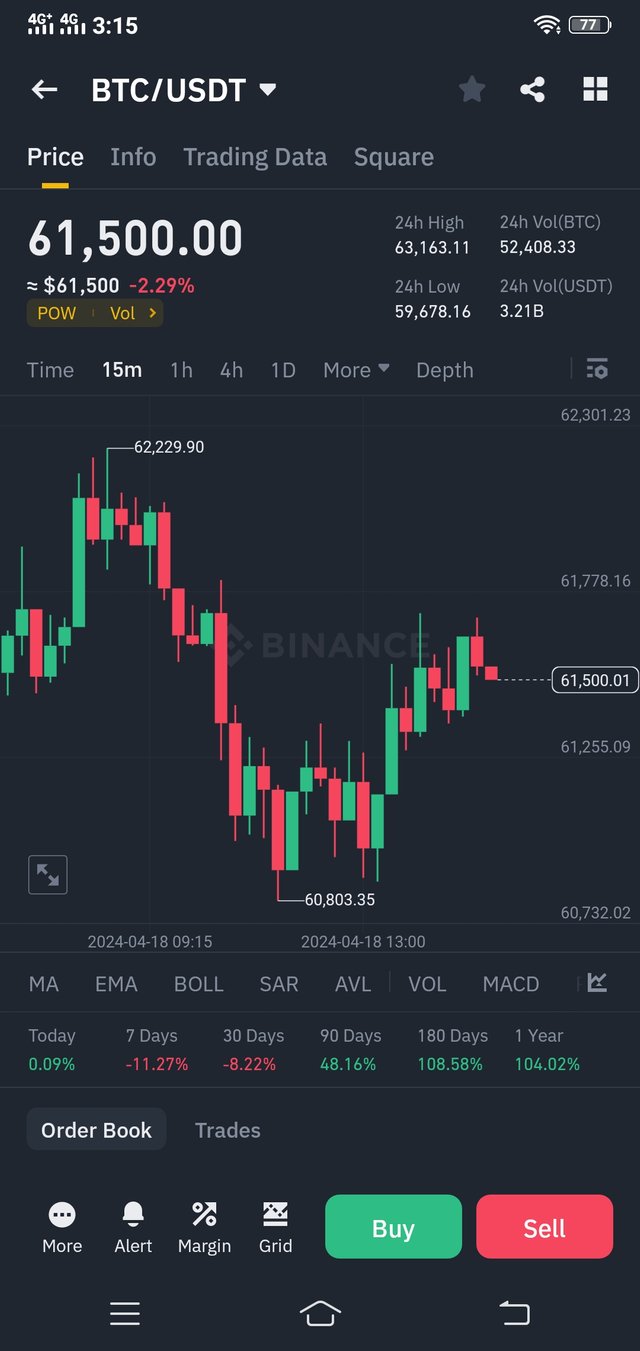
What's Next For #BTC ?
the 60-61k zone is like a red flag. If a candlestick chart shows Bitcoin's price dipping below this zone, it's a sign things might get worse for Bitcoin.
It's an important area because if Bitcoin's price falls below it, it could mean more people selling, which could push the price down even more. We've seen this happen before,
So, keeping an eye on this zone is crucial because it could determine where Bitcoin's price goes next.
Special Mention:
@Cannonwar