Crypto Academy ||Season-2|| Week-6|| Homework Post for @fendit|| Elliott Wave Theory

Applications of Elliot Wave Theory
Elliot Wave Theory was created by an accountant. In this theory, repetitive patterns are settled in a special formation in order to predict the future price of particular asset. This process called Elliot Wave Theory.
According to this theory, if the price in the market is higher or lower, there is a special reason for it. The price of any asset depends on the previous record of how its price has behaved in the past. The price change in the market sets up a specific chart that is created for a particular time. If such a valuable change occurs again, it helps us to estimate the new value.
If we talk about this theory, we have eight stages in it. Five of these eight stages start the Growth Period. And the next 3 stages show the falling price of acid in the market. People who trade know about this view. They use this Wave to estimate the expected future value an asset. And that was the purpose of this theory. We need to know what the value of a particular asset will be in the future. This is a tool used in web theory technical analysis. And the trader who knows how to use it well can make a good profit in the future by estimating the correct prices of Asset.
What is Impulse Wave?
This theory consists of eight stages. The first five stages are called motion waves and the other three waves are called correction waves. Now we know how these waves are formed and how they are used.
Impulse Wave is a Wave that goes along with the market trend. Impulse wave basically consists of five stages. This view shows a very valuable difference.
Bullish Elliot wave
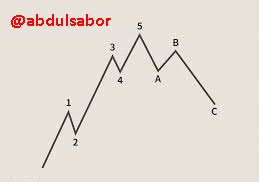
Wave 1:
As we can see in the picture, the first wave is relatively small, which means that people bought it in very small quantities and at a low price, so its graph has gone up.
Wave 2:
This Wave is relatively small and down trend. This means that people have sold their assets and made a profit. So, you can see that the wave trend is downward. But this trend will not go below the first wave.
Wave 3:
As you can see in the picture, the third wave is the longest because as the graph came down at the end of the second wave, people bought more assets at a lower price, which caused the wave to move upwards. It turns out that people have invested more in it.
Wave 4:
You can also see in the fourth view that people sold their assets again and made a profit, due to which the trend of view is downward.
Wave 5:
In the fifth view we can see that investors bought assets again. This time the price was not so low but still the investment is very high so the trend of this wave went upwards. This is how we see how this view is formed and how it works.
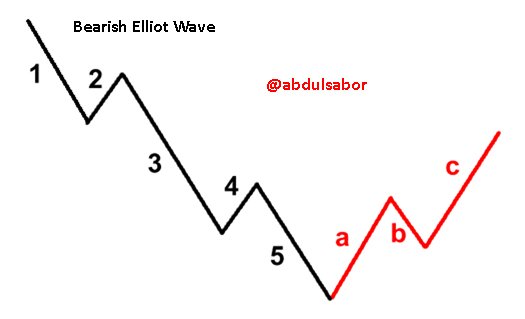
Bearish Elliot wave Theory
It is same as Bullish Wave. But its behavior is different. It is totally opposite to bullish Wave theory.
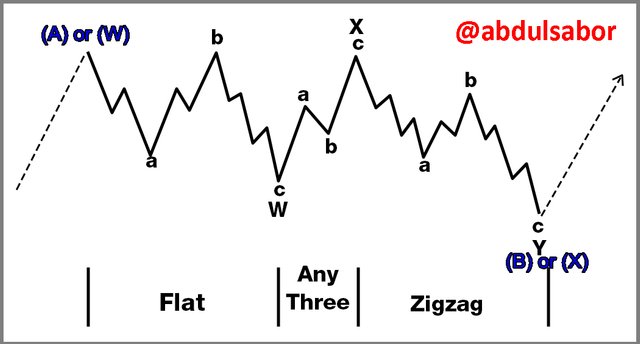
What is Correction Wave?
As we saw in the graph, the correction wave starts after the impulsive wave. This wave is moving in the opposite direction of the market trend and it is difficult spot it. After five stages, Wave A, Wave B and C Wave comes. Wave A and Wave C go in the same direction and B does not go in that direction.
Zigzag Wave
If the given view is in Zigzag format then A and B will be smaller than C view and you can see in the graph that the price in B has gone up slightly
Flat Wave
If the given wave is in a flat shape, it will be easy to spot it because it has a connection between the three waves. The length of each wave is almost equal.
Triangle Wave
If the given view is in triangle shape. So, it will be very difficult to spot it. Because volatility and volume both are in down trend.
How we can easily Spot All Waves?
It is easy to sort all the wave given in this theory, it is possible because all waves are working on the Principal and we keep a thorough knowledge of this wave and it will not be very difficult to find it. Suppose we are in the uptrend at the beginning and it is wave 1 it will be upwards then the wave will be downwards but it will not go below wave 1 then wave 3 is the biggest Wave. The trend of Wave will be upwards then wave 4 and its tendency will be slightly downwards then wave 5 will also have its tendency towards upwards.
That way we can easily spot the views
If we take the example of this Steem, the first price has gone up
Wave 1: Start point $0.5 and ends on $0.8
Wave 2: is Slightly Down But it avoids to
Cross $0.5
Wave 3: Ending Point 1.4 dollars.
Wave 4: travel in down trend ending point $1.2
Wave 5: Travel in uptrend and ending point $1.8
Correction Wave
Wave A is on Down Trend ending point $1.3
Wave B is on uptrend ending point $1.5
Wave C on down Trend ending point $1.1
What are your Perceptions about This Wave Theory?
When something is made, it has a purpose. Similarly, if this theory was sent, it also had a purpose. This theory was made to estimate the future value of certain laws. And in my opinion, this theory is perfect for estimating the future value of a queen. If we talk about how it works, it is a bit difficult because it is a bit difficult to understand. Because not every person can estimate it, we must have all kinds of information about it before estimating the price. But some people say that this theory is not useful at all, they think that technical analysis is a better option.
This theory is very useful if we get complete information about this theory and learn how to use it well, then we can estimate true expected value of particular asset in future.
B: Choose a Coin chart in which you were identify all impulse and correct waves and explain in detail what you see. Screenshots are required and also mention the name of cryptocurrency which you are going to analyze.
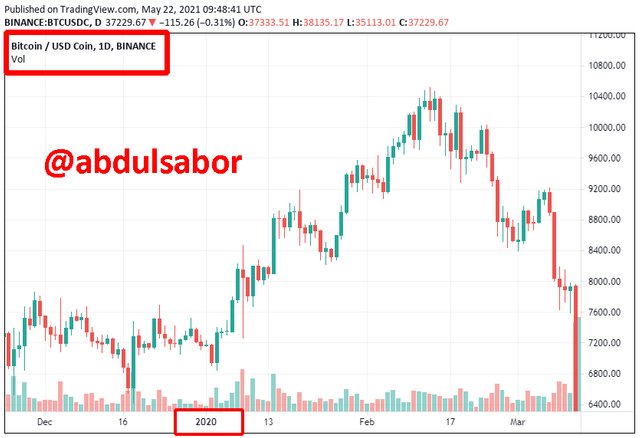
I going to select BTC/USDC coin pair for analyzing and identifying the impulse and correction waves. The chart is taken from the coinmarketcap website. The area where I found the impulse and correction wave is near about Dec 17, 2019 to march 2020. In between this time period I figure out Impulse and corrective wave.
In this chart we will clearly see Impulse and corrective pattern it the given chart. In this chart we consider that the wave 1,2,3,4 and 5 are impulsive wave and A, B and C wave are considered as corrective wave. In the following chart I only point out the area where we can draw the Elliot Wave.
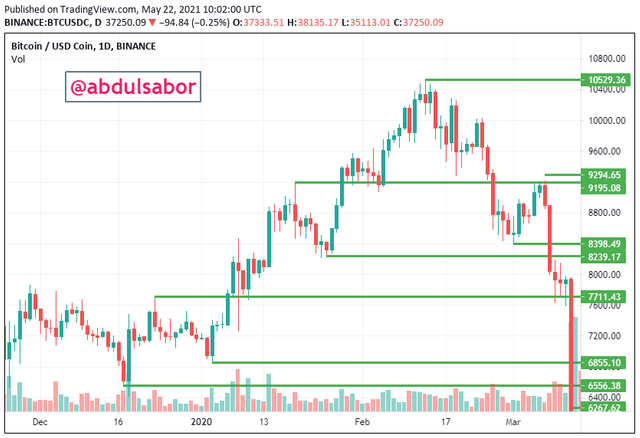
In the following figure you can see that every wave is drawn on the BTC/USDC trading view chart. In this chart will understand how wave is formed and what points that consider for the formation of Elliot Wave.
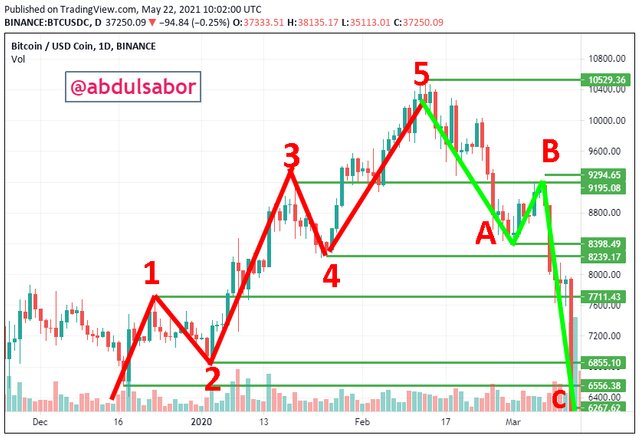
Impulsive Wave
The first 5 waves are in bullish trend. Every wave has its unique bearish and bullish behavior. But overall the Impulsive waves has bullish trend.
Wave 1:
It's starting point is $6556. It behavior is bullish. This is because chart is on uptrend. Wave 1 ended at $7711.
Wave 2:
It's behavior is bearish. This because chart is on downtrend and ending point at $6855.
Wave 3:
It is the longest wave. It's behavior is bullish. This because chart is on uptrend and ending point at $9195.
Wave 4:
It's behavior is bearish. This because chart is on downtrend and ending point at $8239
Wave 5:
It's behavior is Bullish. This because chart is on uptrend and ending point at $10529.
In this way we figure out that how Elliot Wave are formed and what are the individual and overall behavior of these waves.
Correction Waves
Next Correction Waves has also different behavior. Overall its behavior is bearish. Wave A, B ans C are considered as Corrective Waves.
All the waves that are include in corrective waves has the bearish market trend.
Wave A:
It has bearish behavior and ending point is $8339.
Wave B:
It also has bearish behavior and ending point is $9294.
Wave C:
It has bearish behavior and ending point is $6267
These the corrective waves. This is how they formed in BTC chart.
Conclusion
Elliot Wave Theory is very good tool that is used in Technical Analysis. We can predict the future price of a particular asset by using Elliot Wave Theory. If we know the complete information that how to use this theory then hopefully it will generate posible correct future value of particular asset.