Crypto Academy / Season 3 / Week 7 - Homework Post for Professor [@yousafharoonkhan] : How To Create An Account On TradingView, How To Use Indicators,Tools, Features of TradingView
This is my homework post for Steemit Crypto Academy Season 3 Week 7 for Professor @yousafharoonkhan’s lesson How To Create An Account On TradingView, How To Use Indicators,Tools, Features of TradingView.
PART 1 – THE SITE
1.a. TradingView Site
TradingView (https://www.tradingview.com/) is a site that provides various benefits for users to conduct market analysis. There are various tools provided for traders to be able to gather information about what is going on in the market. The most important feature of TradingView is the Charts. This TradingView chart is very popular and is used as a reference by various other trading sites such as CoinMarketCap, Coingecko, and even markets such as UPbit. Information provided by TradingView includes trading fiat, cryptocurrencies, stocks, indices, futures, bonds, sparks.

TradingView also maintains a community, where members can contribute by submitting their articles. Moderators will curate the articles submitted there, and the selected articles will be rewarded in the form of coins. Community members can also interact and talk to each other to discuss things related to trading, market analysis, and other trading-related matters.
So, in TradingView, users can get up-to-date information on market conditions, read articles and interact with each other. All the features available there can be used by users to help them analyze and understand market conditions and decide on their next steps. Registered users can have access to analytical tools that can help them.
1.b. Registering an Account in TradingView
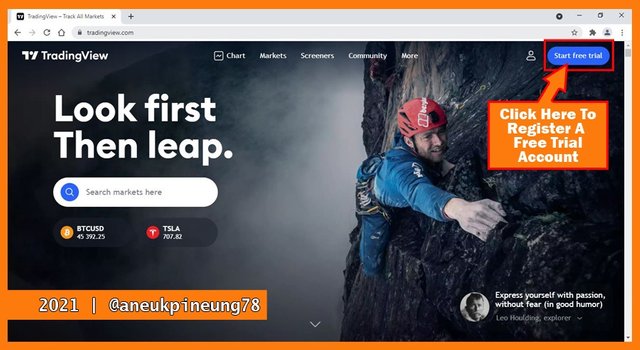
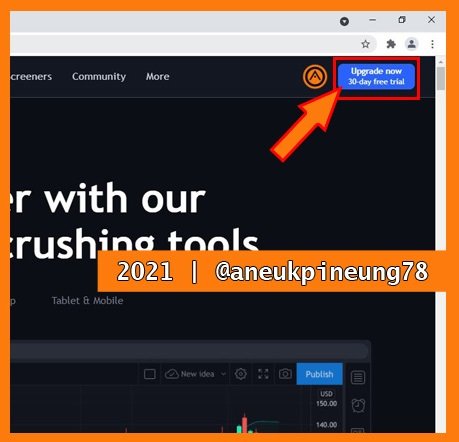
At this time I will register a free trial account on TradingView, so I opened its website, and clicked the [Start Free Trial] button.
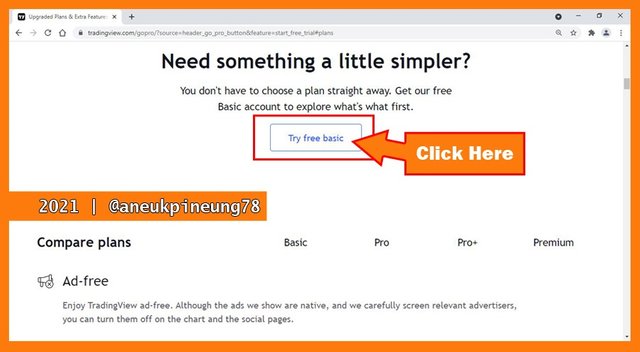
On the next page, I scrolled down until I see the [Try free basic] button. I clicked on it.
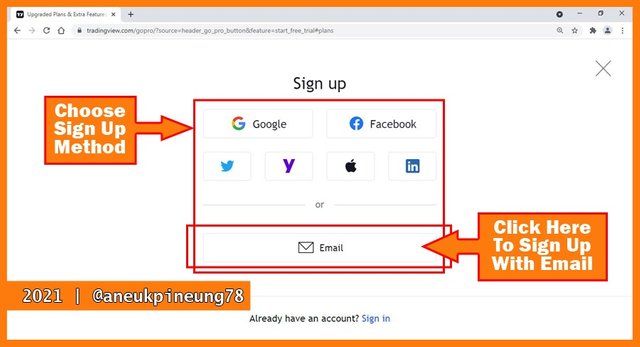
On the next page I was given some sign-up options: Google, Facebook, Twitter, Yahoo, Apple, LinkedIn, and Email. I chose Email.
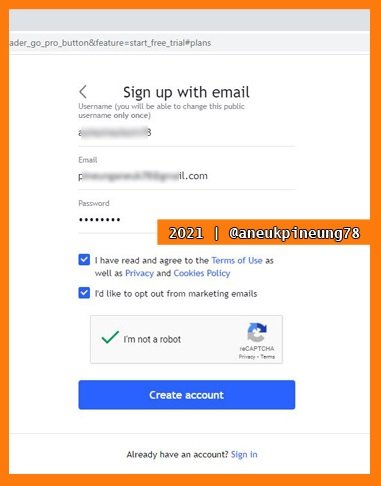
Next I was asked to fill in my credential: username I'd like to use, my Email address (this will basically be used for confirmation purpose), and password. Ticking the first radio button (comply with Terms of Use, Privacy and Cookies Policy) is a must, means you will not be able to proceed further if you did not tick it. The second radio button is optional. Did the human checking procedure. And lastly, I clicked on the blue [Create account] button.
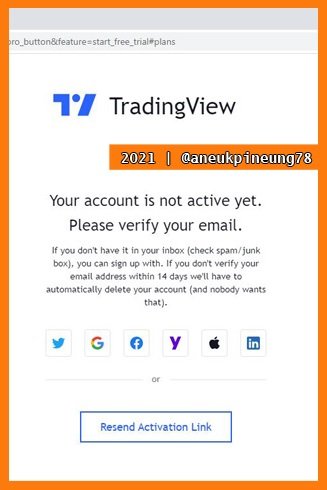
On the next page, TradingView asked me to verify my email.
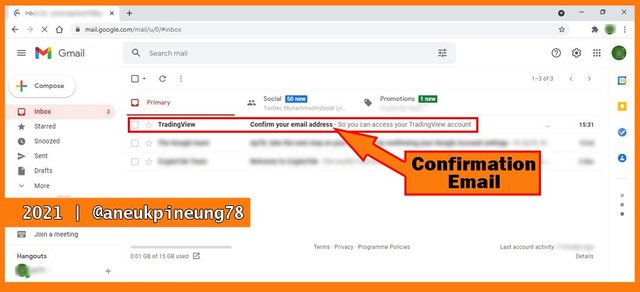
So I opened my email. I saw an email from TradingView. I clicked to view it.
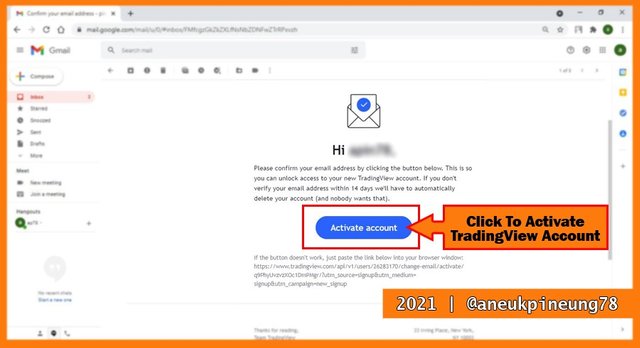
A typical confirmation email, there is a button that we have to press to confirm the email that we registered earlier. I clicked the button.
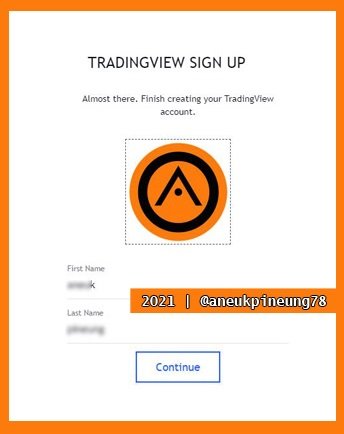
A new window opened on my browser. On this browser, I was asked to choose an avatar and write my first and last name. When I was done, I clicked the [Continue] button.
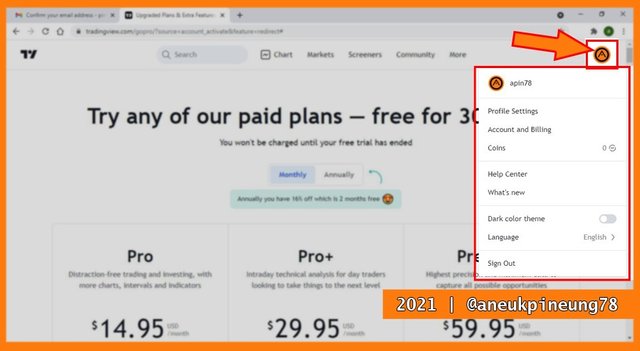
The next page showed me that I was already registered on TradingView. My avatar was shown on the upper right of the window. When I clicked on the avatar, a drop-down menu appeared.
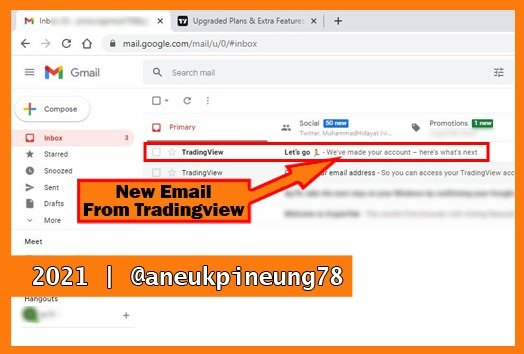
I went bact to my email, there was another email from TradingView.
This email was informing that my TradingView account had been ready to use.
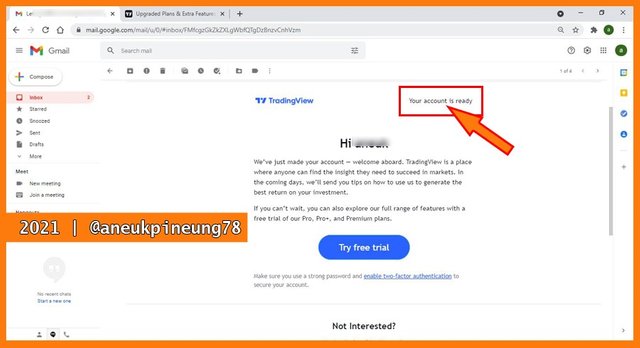
The free account will be expired in 30 days.
1.c. Registration Plans Available in TradingView
There are three other plans besides the free plan available on TradingView: Pro, Pro+, and Premium.
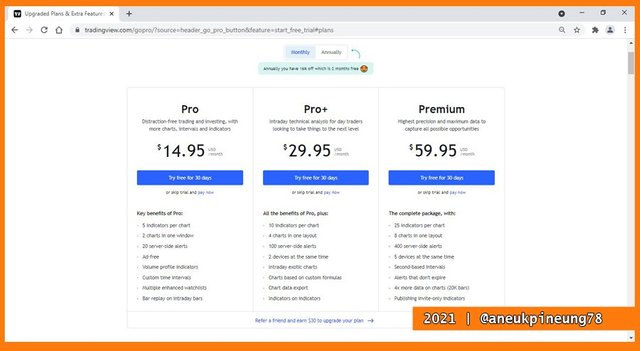
The Pro plan worth USD14.95 monthly, while Pro+ and Premium worth USD29.95 and USD59.95, respectively. However, for one year subscription users will enjoy a 16% discount, or only need to pay for 10 months, this applies to all plans. The higher the type of plan, the more benefits and flexibility the user will get. Users can use more indicators on each chart, more charts in one window, more server-side alerts, and so on. Users can adjust the budget according to their needs to get a plan that suits them.

PART 2 – THE FEATURES
2.a. TradingView Features
The overview of the features is seen on https://www.tradingview.com/features/.
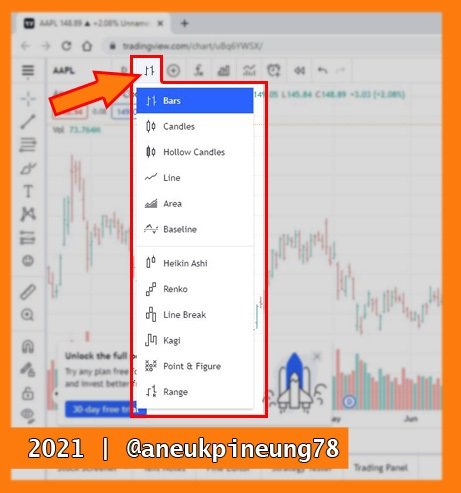
- 2.a.1. Chart
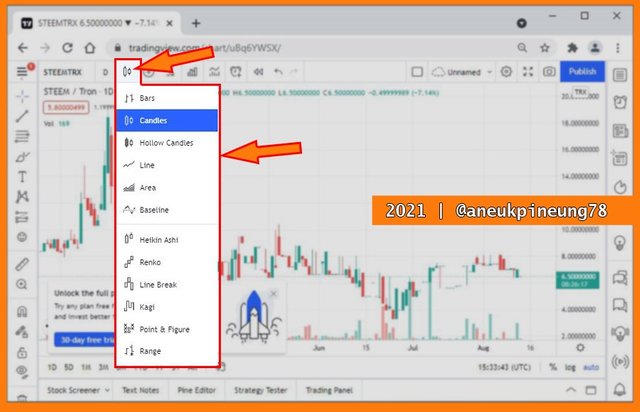
TradingView provides 12 types of chart for the convenience of its users. Users can choose any one of the types that they prefer. The 12 types are: Bars, Candles, Hollow Candles, Line, Area, Baseline, Heikin Ashi, Renko, Line Break, Kagi, Point & Figure, and Range. Take a look at the image below.
Charts are reinforced with a variety of tools, including technical analysis, alerts, and so on. Some of them are:- 1. Technical Analysis
Hundreds of pre-built indicators are availabel to use, including the most popular ones. More than 100,000 community-built indicators also are available to use on the platform. Alongside, there are also more than 50 smart drawing tools availabel. Among another are: candlestick pattern recognition, volume profile indicator, and multi-timeframe analysis.
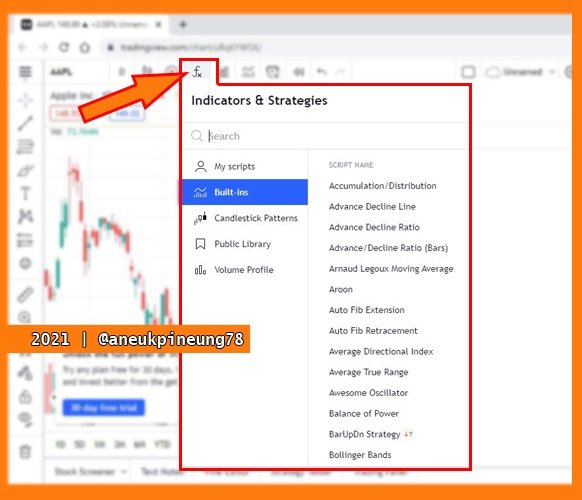
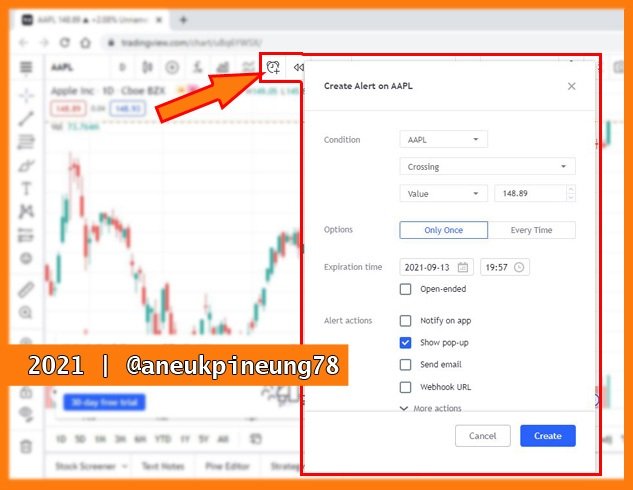
- 2. Alerts
TradingView trading alerts are cloud-based, which are claimed as being available on any device. The TradingView trading alerts are also claimed as the most powerful, flexible, and easy to use. Users can set alerts on price, indicators, and strategies, so they will never miss a trade.
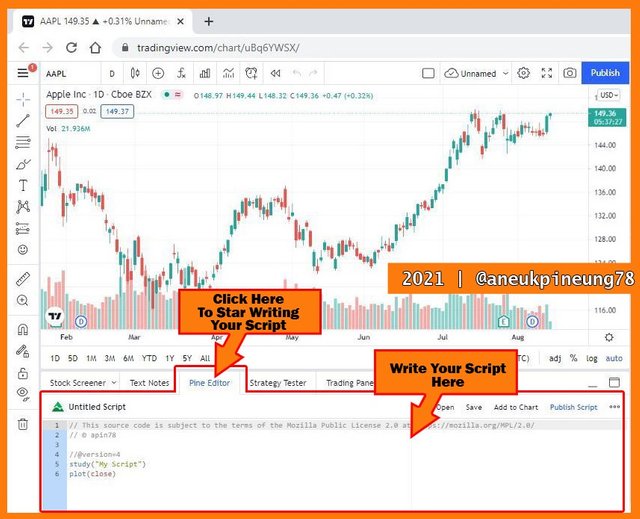
- 3. Pine Script
Pine Script is a scripting language designed by TradingView. The purpose of this script is so the users could write and share their indicators and strategies. Thanks for thsi script that now more than 100,000 community-built indicators are available on the platform. Read the details about this here. Pine Editor is available at the lower side of a chart.
- 1. Technical Analysis
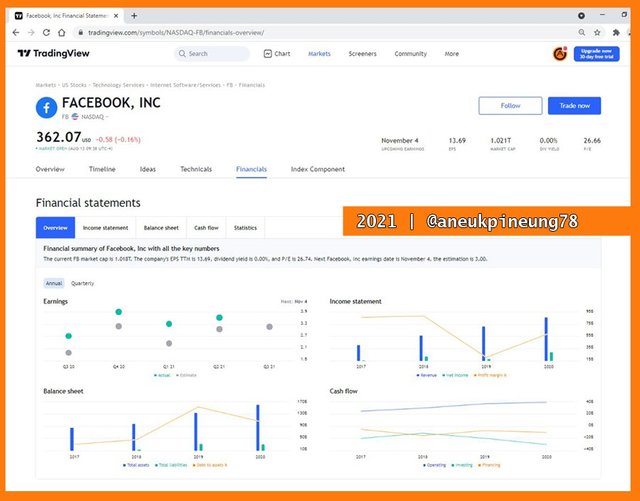
- 2.a.2. Financial Analysis
The TradingView Financial Analysis consists of Income Statement, Balance Sheet, Cash Flow, ans Statistic.
Below is the image of the TradingView Overview tab on Finacial Analysis page of Facebook, Inc., on NASDAQ when I was doing this task. The page is at https://www.tradingview.com/symbols/NASDAQ-FB/financials-overview/.
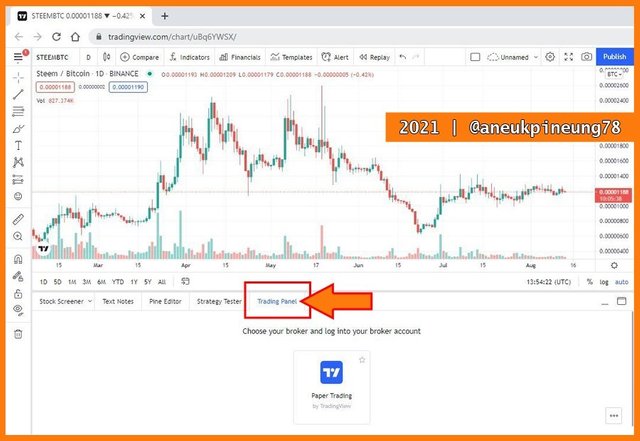
- 2.a.3. Trading
Not only a place for gathering information, users can also conduct trades on the platform, directly on the chart, quickly and easily. To trade from the chart, just click the [Trading Panel] at the bottom of the chart, and select a broker from the list.
- 2.a.4. Social Network
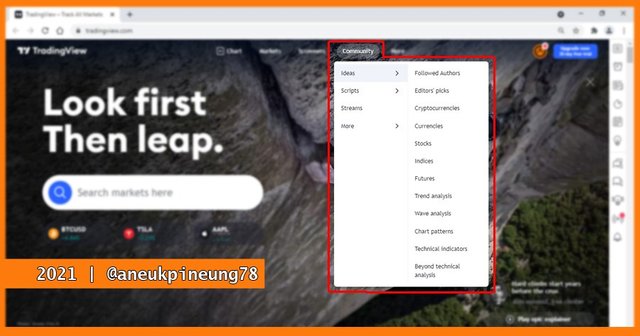
Social network on TradingView is all about trading and investing. Users can:- 1) Blog (write and publish or broadcast their ideas and analysis), follow another users, it's like another social media. And every user can also comment and reward another users blog. To read blogs, just click on the [Community] button on the horizontal menu bar at the top of TradingView page. From there users can choose from categories they'd like to read.
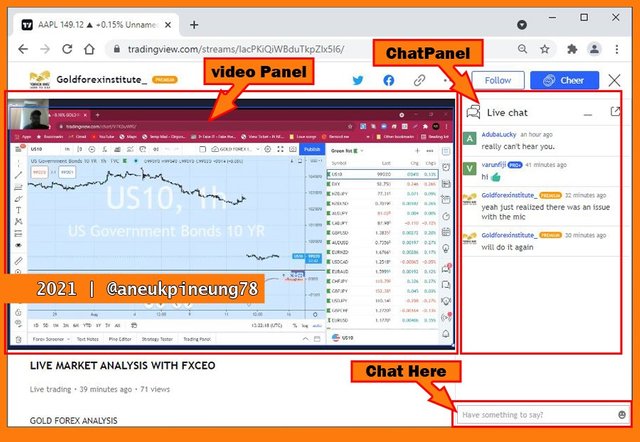
- 2) Trading Live Streaming
Users can live stream their trading on the platform. And another users who watch can comment. When the streaming ended, the video will be available under "Recent Streams" category.
To watch streams, simply click the [Streams] button on the right pane of the chart window.

The Streams panel will open. Click on one to watch.

The stream page will open.
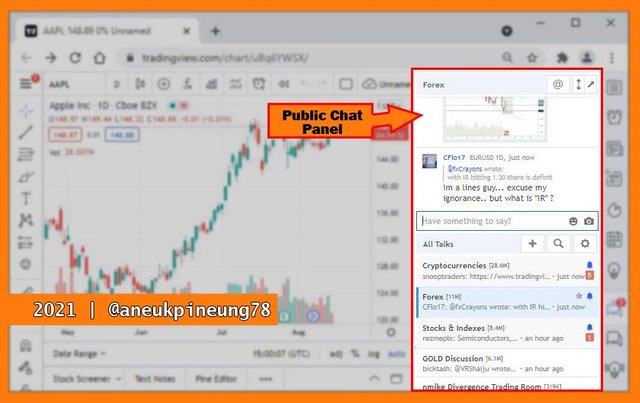
- 3) Reat-Time Chat
There are two types of chat: public and private. Just click on the icon to bring on the chat panel.

The chat panel will open. Below is what a public chat panel looks like.
The image below shows that I have no private chat at the moment.

- 1) Blog (write and publish or broadcast their ideas and analysis), follow another users, it's like another social media. And every user can also comment and reward another users blog. To read blogs, just click on the [Community] button on the horizontal menu bar at the top of TradingView page. From there users can choose from categories they'd like to read.
2.b. My Favourit Feature and The Reason Why
Chart has become my favorite feature in TradingView. This is because Charts provide quick information about what is happening in the market. I don't trade much, but I do invest in several types of tokens, so I regularly look at the charts. Another reason is because I attended lectures at Steemit Crypto Academy where charts often appear in the discussion, especially if the class is about trading.
PART 3 – THE CHART EDITING
3.a. Setting Up A Chart In TradingView
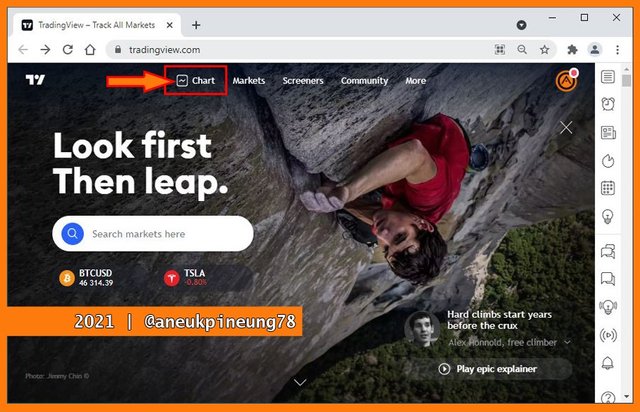
I opened https://www.tradingview.com/ and hit the [Chart] button on the horizontal menu.
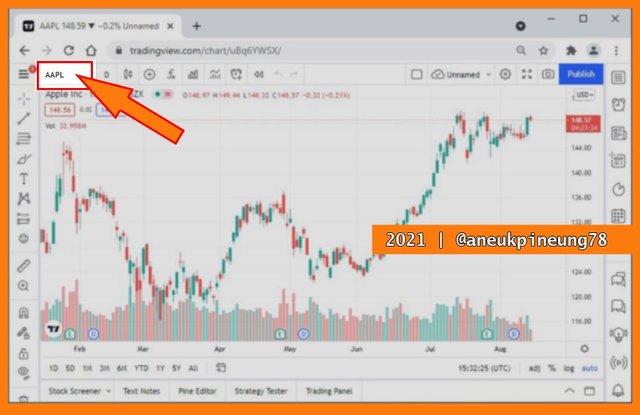
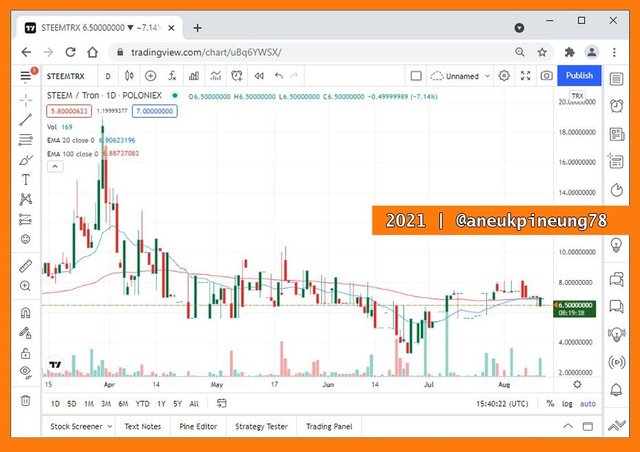
I clicked on the asset symbol to change it to the asset I wanted, in this case I wanted STEEM/TRX.
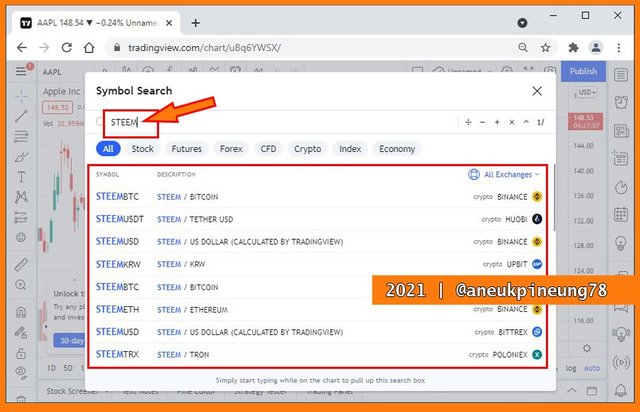
I typed STEEM in the search box and chose one from the result area.
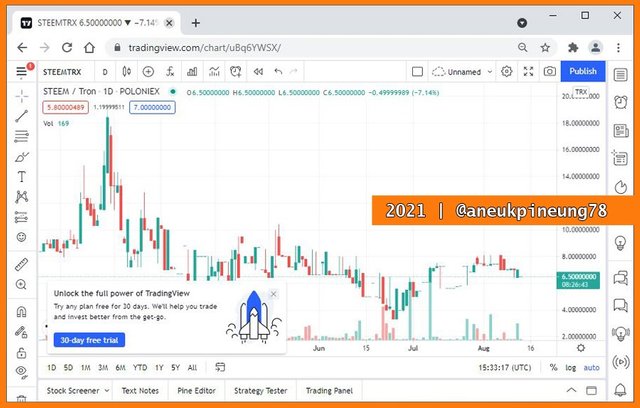
I had it.
I can change the chart type by clicking on the chart type symbol.
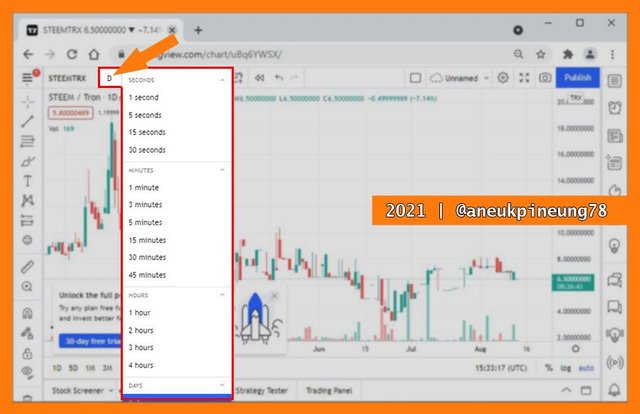
Clicking on the timeframe button to change the timeframe.
Indicators and strategies can be applied so easily. Just click the button and choose one.
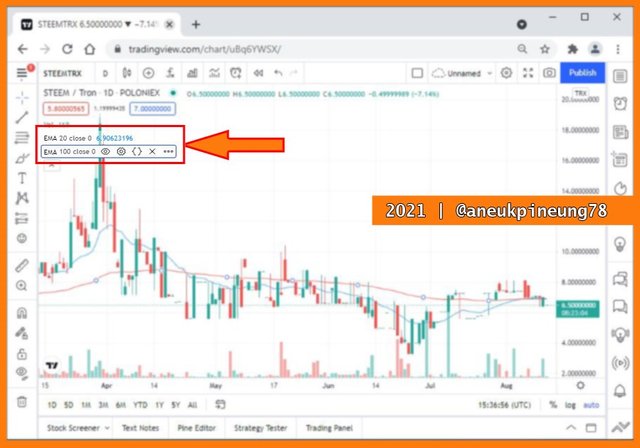
The picture below shows that I had applied two EMAs on the chart.
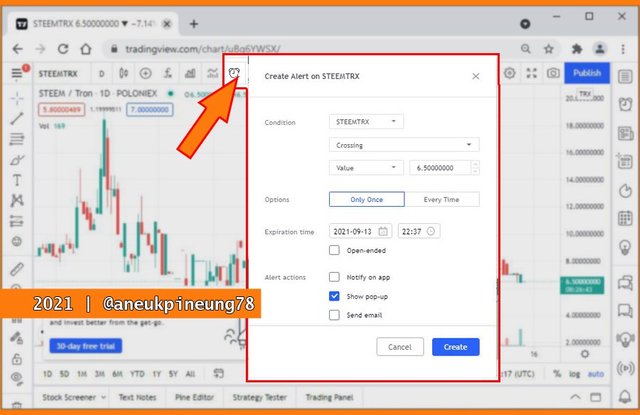
Another great feature on TradingView is Alert.
To arrange chart properties, just click the jagged circle icon on the upper right corner of the chart. It is basically used to set up the chart appearance.
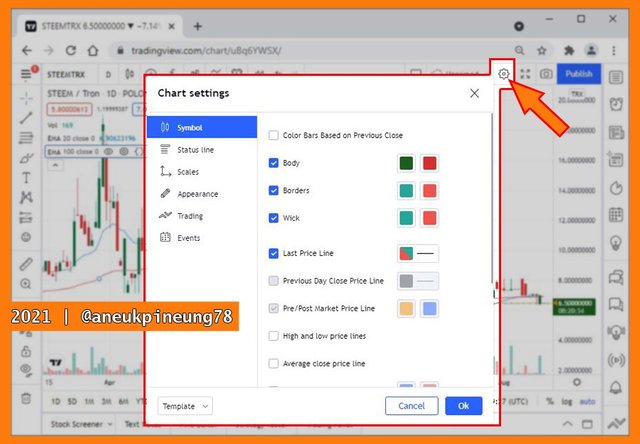
Here was what I got.
3.b. Using Two Tools To Edit Chart In TradingView
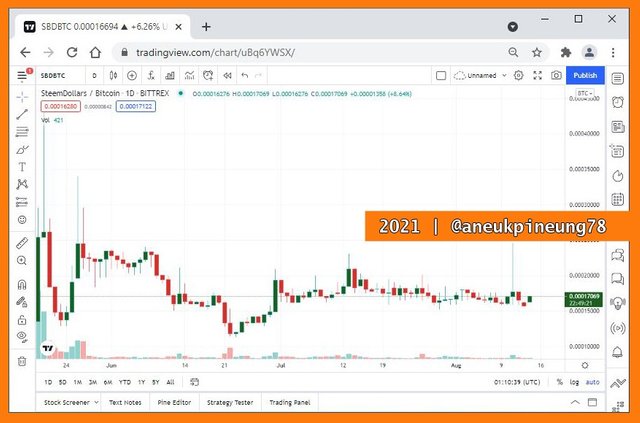
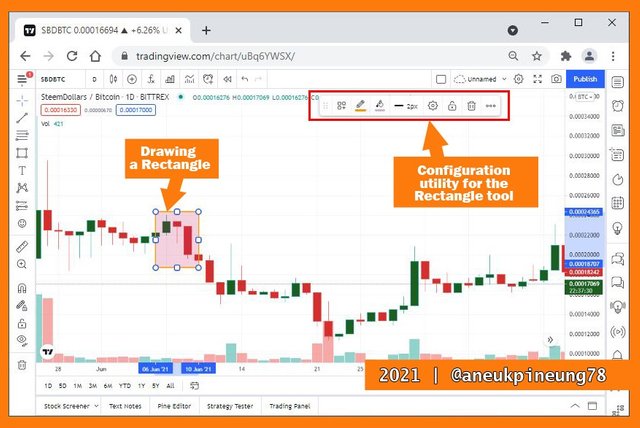
For this task I used the Bittrex SBD/BTC Chart, on 1 Day timeframe. I used two tools on this chart to highlight a pattern. The two tools were rectangle and text.
The rectangle tool is available under the geometric shapes category. The default tool was brush. I clicked on the tiny right pointing arrow next to it (shown when the pointer hovered on the icon) to open a drop-down list, and from there I chose rectangle.
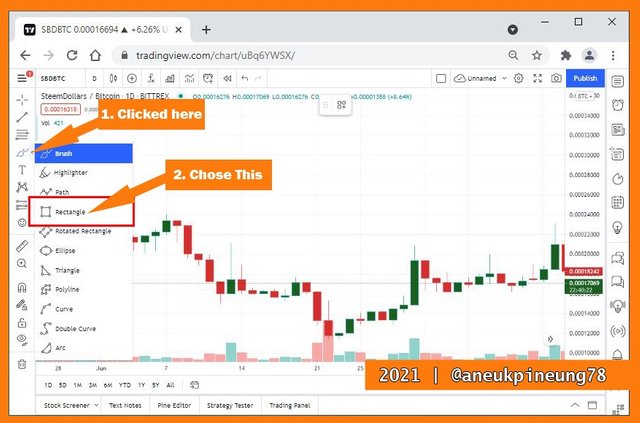
I then started to draw a rectangle around an Evening Star pattern. The configuration utility is useful to edit the rectangle appearance.
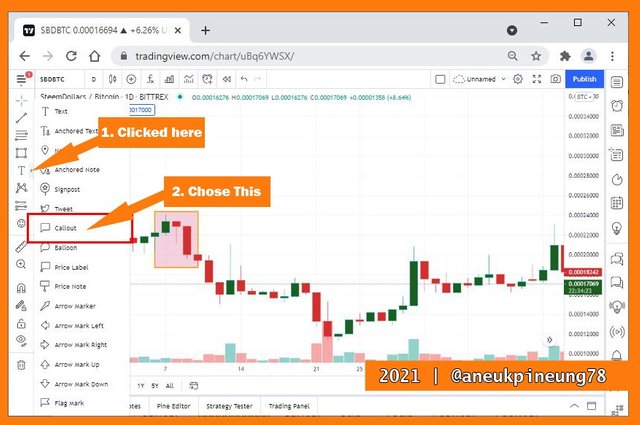
Next I used the second tool, the text tool to write information about the pattern I had highlighted. So I clicked on the tiny arrow next to the text category. I chose the Callout.
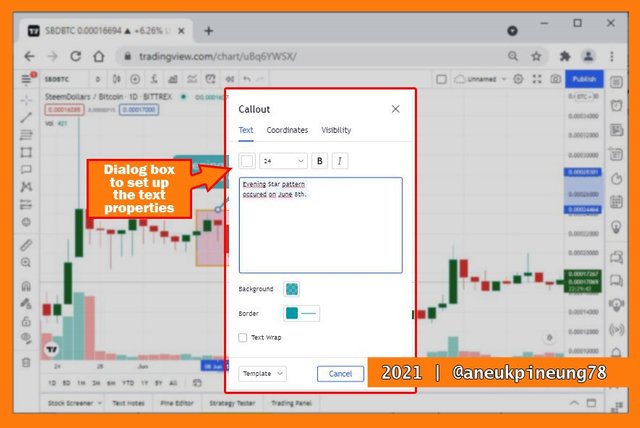
The Callout pop up window opend. I started typing the text. When I was done, I clicked the [OK] button. I can always edit it later.
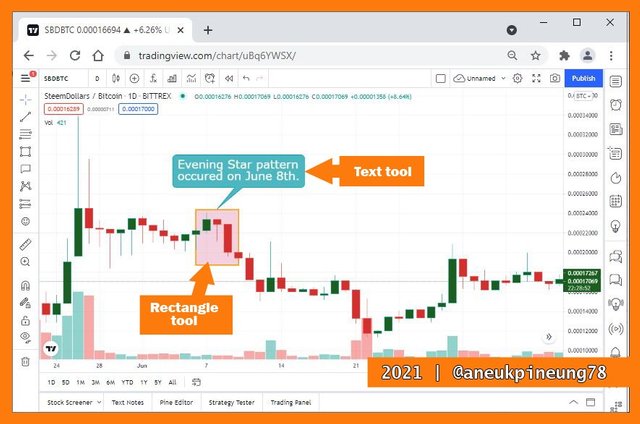
The final result showed on below image.
PART 4 – THE CHART INDICATORS
4.a. Adding Indicator In Chart In TradingView
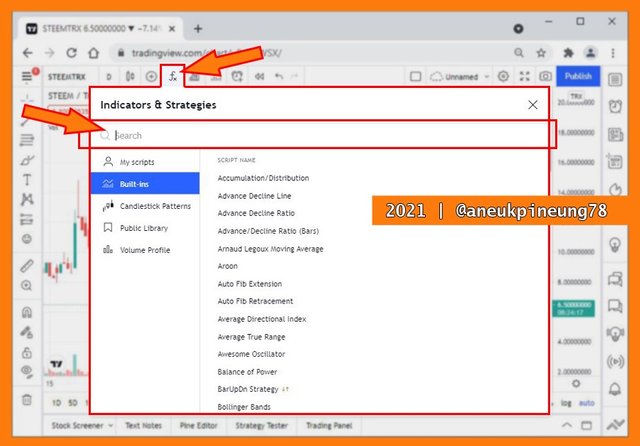
On this task I used the same chart as on the previous task. To start adding indicators to a chart, I simply clicked the Indicators button on the chart menu.
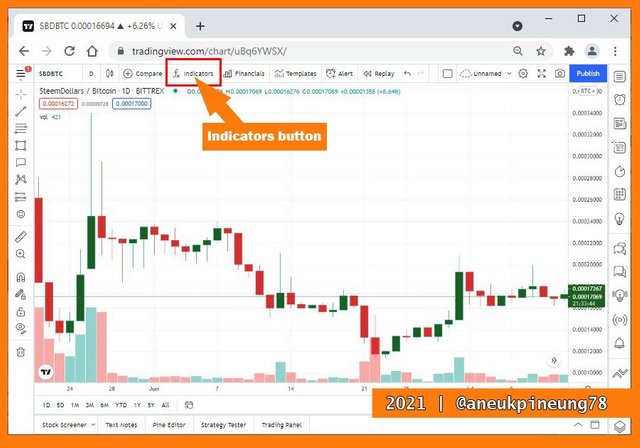
The Indicators & Strategies box popped up.
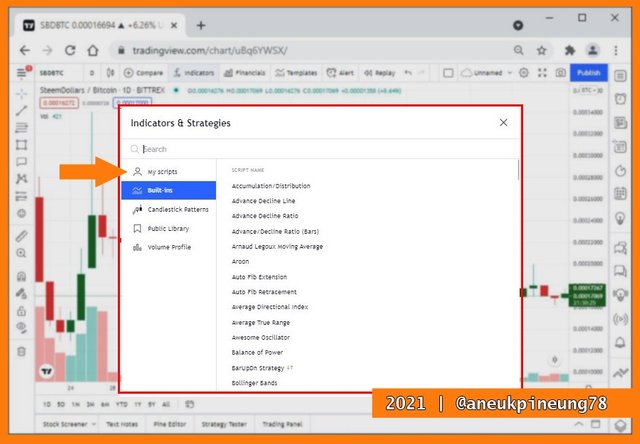
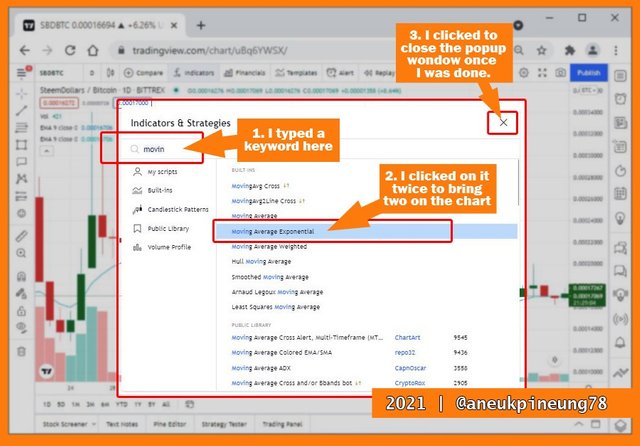
I can easily choose form the suggested indicators, but I did not find one I need, The Exponential Moving Average. So I typed the relevant keyword inside the Search box, and chose from the result list below it. Since I wanted to use two EMAs, I clicked on it twice. When I was done, I clicked on the close window button.
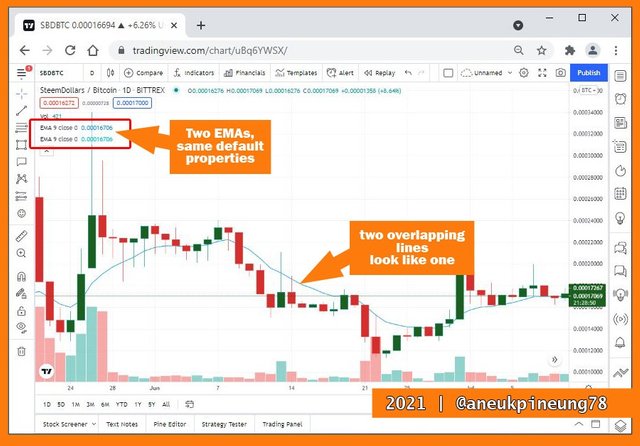
The picture below shows the result. There were 2 EMAs on the chart, with the same default parameters, so the EMAs lines were overlapping each other.
I needed to adjust both the EMAs parameter to feed my need. I hovered on the EMA, and from appearing menu I clicked on the setting button.
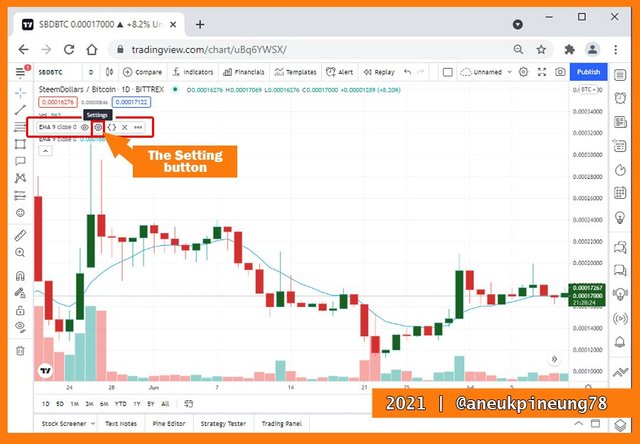
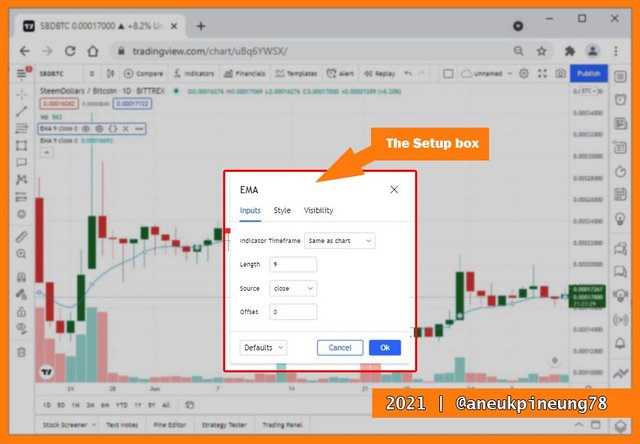
The EMA pop up box appeared on the screen. I adjust the parameters here.
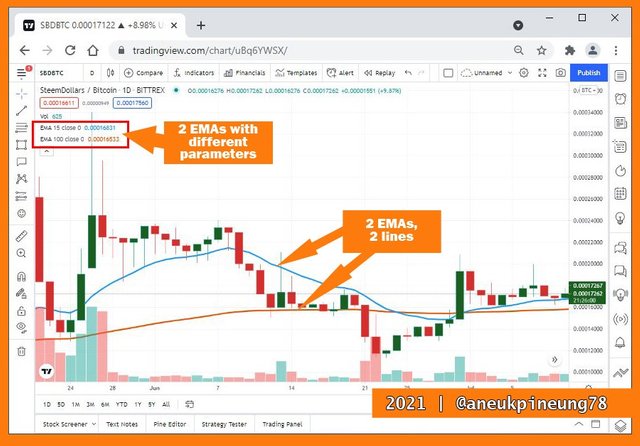
I did the same steps for both the EMAs. When I was done, I have 2 EMAs with different parameters to get me going with.
4.b. My Favorite Indicator And The Reason Why
To date, my favorite indicator is the combination of the two Exponential Moving Averages. This indicator is very simple to understand and easy to apply to charts. The combination of these two indicators (one long term EMA and one short term EMA), can provide information when there is a positive or negative signal for an asset in the market. Positive signals are marked with Golden Cross, and negative signals are marked with Death Cross.
- Golden Cross is a positive signal when the short-term EMA crosses the long-term EMA from below. This positive state became confirmed after the short-term EMA remained above the long-term EMA for a long time.

The Golden Cross pattern. - Death Cross is a negative signal when the short-term EMA crosses the long-term EMA from above, and the state is confirmed if it remains in that position for a long time.
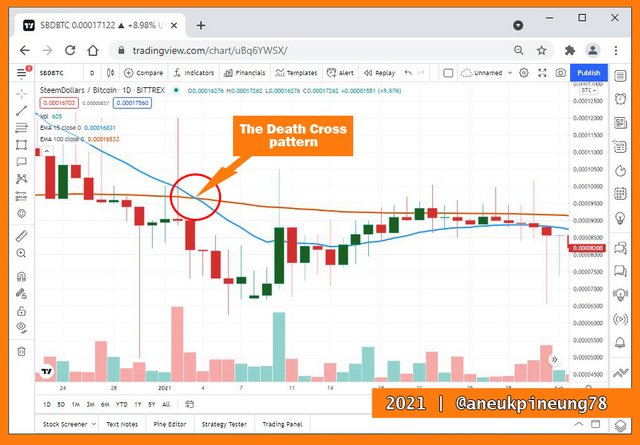
The Death Cross pattern.
PART 5 – THE SITE USEFULNESS
In my opinion, TradingView is very useful for users to predict the market for cryptocurrency. Users might use charts and its tools, indicators, to gain knowledge about the market sentiment to see and predict the market trend and by that to make a better decision.
PART 6: CONCLUSION
TradingView is the premier trading site. This site provides comprehensive information about the market condition. Information is available on various assets, ranging from fiat, cryptocurrencies, stocks, futures, bonds, and others, from various markets.
Its features are useful for users to analyze the market. For example a chart that is equipped with so many indicators, tools, strategies. Charts are also editable, so users can leave important notes on them.
The Community becomes an attractive social feature for users. In this feature, users can submit their ideas and opinions in the form of writing (blogs), commenting on other users' blogs. Live streaming and chat features are also available.
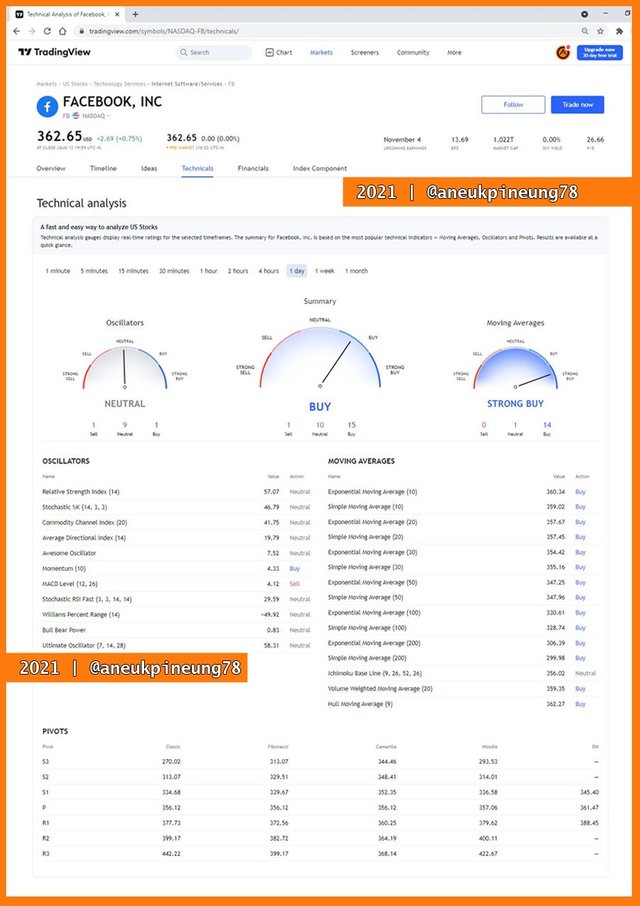
TradingView also provides comprehensive Technical Analysis and Financial Analysis on a particular stocks. For example Technical Analysis for Facebook, Inc., stock on NASDAQ as shown in https://www.tradingview.com/symbols/NASDAQ-FB/technicals/.
With all it has to offer, I think TradingView is very useful for users and helps them understand the market to make better decisions.
Thanks
Thanks Professor @yousafharoonkhan for the lesson titled How To Create An Account On TradingView, How To Use Indicators,Tools, Features of TradingView.
Pictures Sourcing
- The editorial picture was created by me.
- All another pictures were screenshoots from https://tradingview.com and were edited with Photoshop CS 3.


shared to twitter : https://twitter.com/aneukpineung78a/status/1426477804808376326.
Respected first thank you very much for taking interest in SteemitCryptoAcademy
Season 3 | intermediate course class week 7
i liked homework
excellent effort
thank you very much for taking participate