[CRYPTO TRADING STRATEGY WITH MEDIAN INDICATOR] - Steemit Crypto Academy - Homework post for Professor @abdu.navi03 by @aneukpineung78
This is my homework post for Steemit Crypto Academy Season 6 Week 4 of Professor @abdu.navi03’s class Crypto Trading Strategy With Median Indicator.

Task 1 - The Median Indicator
Median Indicator, as the name implies, is an indicator that uses median value data (median price). The most popular median value is probably the median value obtained from the low price and high price.
The Median Indicator is a trend-catching-indicator, meaning an indicator that shows the current trend in the market, so that it can be used to get an overview of future market conditions, namely market direction and volatility.
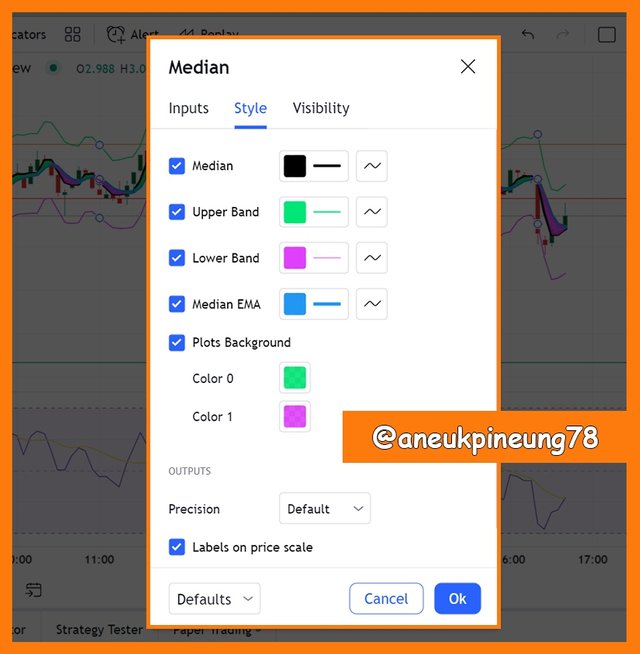
By default, in TradingView, the appearance of the Median Indicator consists of a high price line (Upper Band), a low price line (Lower Band), a Median EMA line and a Median line. The median line which is the middle value between the Upper Band and Lower Band is the "core" of the Median Indicator which with the Median EMA line form a ribbon that indicates bullish or bearish. By default, in TradingView, the Upper Band and Lower Band lines are green and purple, respectively, while the Median and Median EMA lines are black and blue, respectively. These colors can be adjusted according to the wishes of the user. See the following image.
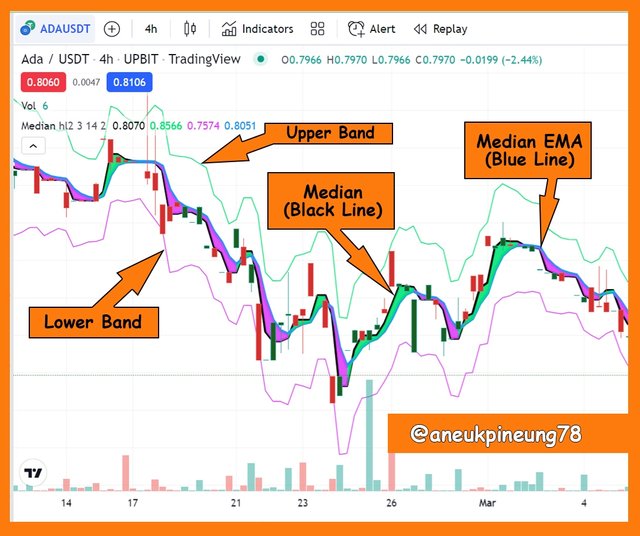
The Median Indicator announces a bullish or bearish occurrence by forming a colored band (ribbon) attached to the Median line. The ribbon is formed by the Median line and the Median EMA line.
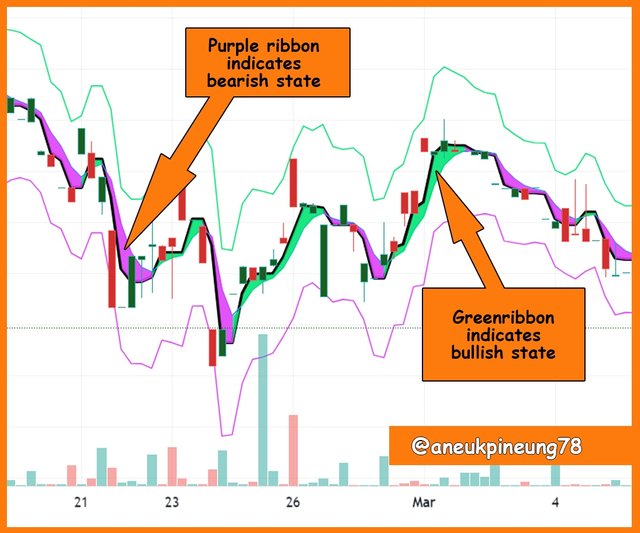
The change of band color on the Median Indicator from purple to green is a bullish signal like the occurrence of a Golden Cross on the use of Double EMAs or the occurrence of an upward cut by Arron Up on the Aroon Indicator. Vice versa, a change in the color of the band on the Median Indicator from green to purple, announces a downtrend as in the Death Cross, there is the use of Double EMAs or an upward cut by Arron Down on the Aroon Indicator.

Task 2 – The Median Indicator Parameters and Its Calculation
2.1. Parameters’ Input
There are five parameters that make up the median as shown in the following figure.
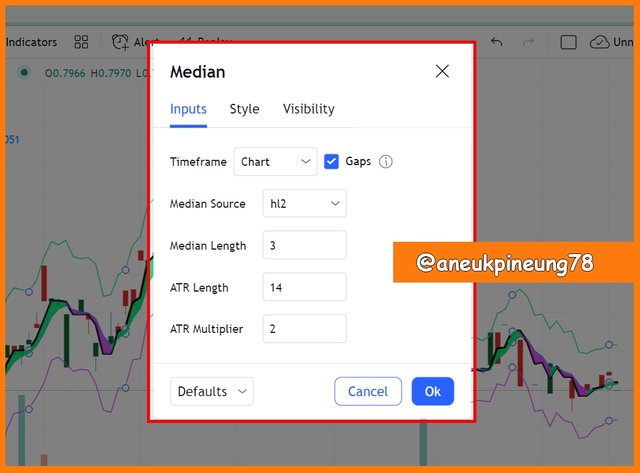
These five parameters inputs can be set to meet user needs. The following is a brief explanation of the five parameters:
- Timeframe. As the name implies, this is a timeframe setting. The timeframe by default is set to follow the price chart timeframe, if the price chart has a 1-hour timeframe, by default the Median Indicator also has a 1 hour timeframe.
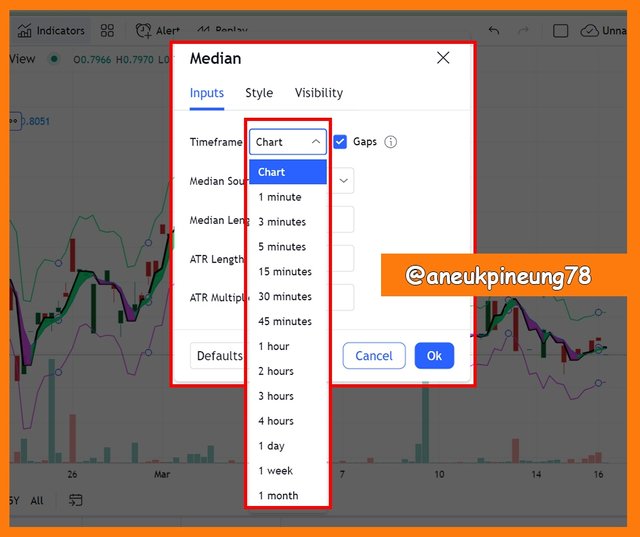
Changing Median timeframe can be done by choosing the options from a dropdown list. Image source = TradingView. - Median Source. The Median Source is the source from which the median value is obtained. By default, this source is hl2, which means, the median value is obtained by dividing the sum of the high and low prices ( [high + low] : 2 ).
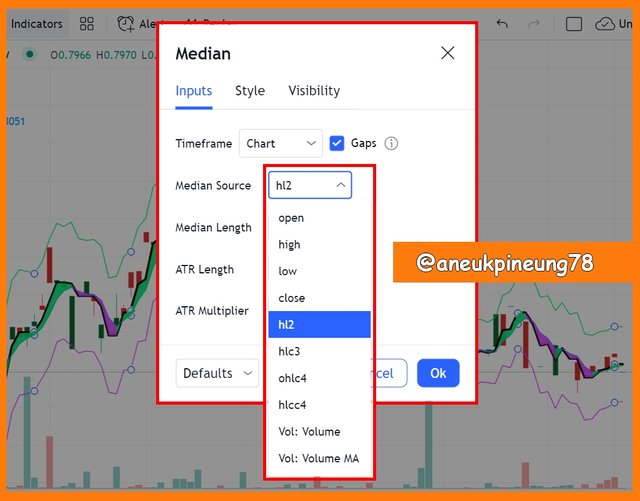
Users can change the median source to meet their needs from the dropdown menu. Image source = TradingView.
Apart from hl2, some other median sources are:- hlc3. The median value is obtained by dividing by 3 the results of high + low + close ( [high + low + close] : 3 ).
- ohlc4. The median value is obtained by dividing by 4 the results of open + high + low + close ( [open + high + low + close] : 4 ).
In addition, the Median value can also be sourced from Volume and Volume MA, and another sources as seen in the image above.
- Median Length. Median Length is the amount of data entered and used as the basis for calculating the Median value. On the TradingView platform, the Medium Length value is set to 3 by default.
- ATR Length. ATR stands for Average True Range, which is the average value in true ranges over the specified periodSource. ATR is the “main component” of the Median Indicator. It can be said that the Median Indicator is built on the foundation of the ATR theory. ATR Length is the ATR period that is set to calculate the value of the Median indicator. By default, in TradingView, ATR Length has a value of 14 (which means 14-period was set to calculate the Median value).
- ATR Multiplier. This is the number assigned to ATR multiplication. By default, TradingView sets the ATR Multiplier value of 2.
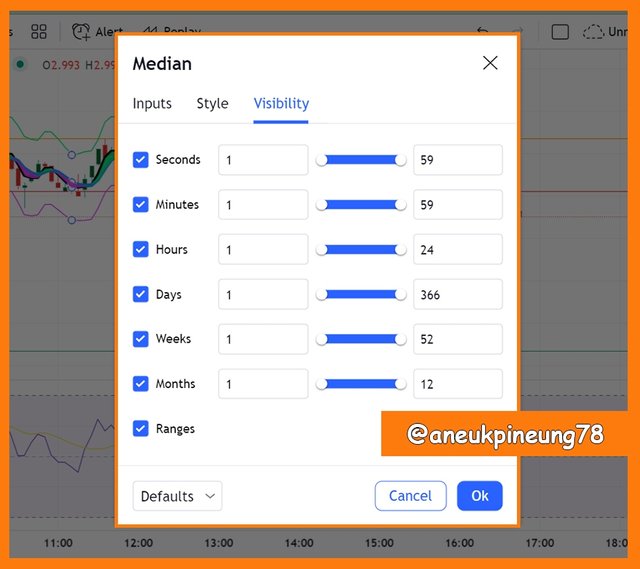
2.2. Parameters’ Style and Visibility
As so the Median Indicator’s value and calculation basic (inputs) can be adjusted, so are its style and visibility. Maybe a user wants another color for Upper Band and/or Lower Band, it is editable, just like any other technical analysis tools there are.
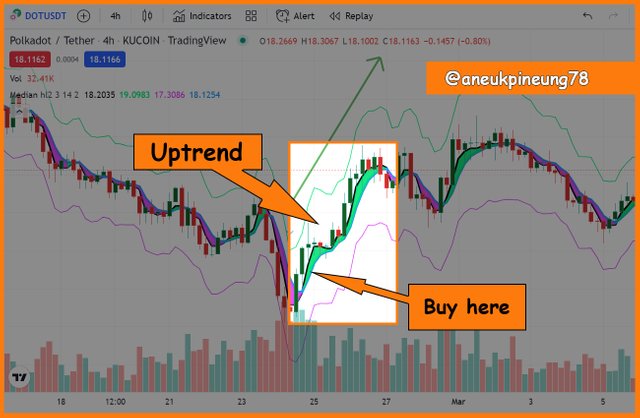
Task 3 - Uptrend from Median Indicator
In the Median Indicator, an uptrend signal is indicated by the formation of a green band by Median and Median EMA. When the Median line has a higher value than the Median EMA line (the Median line is higher than the Median EMA line), the space between them will be filled in green to indicate the occurrence of the bullish. The screenshot below is the example to the bullish (uptrend) information in the Median Indicator.
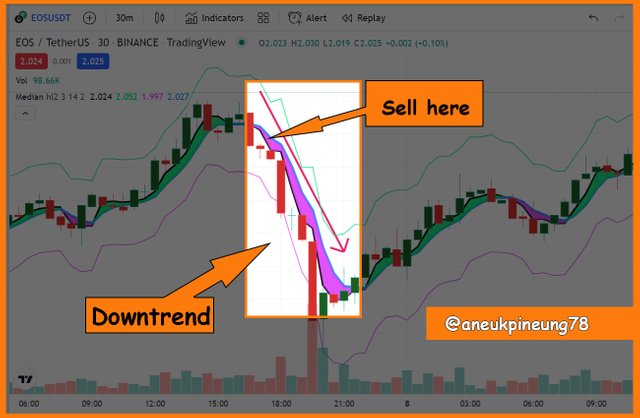
Task 4 - Downtrend from Median Indicator
While, for the downtrend, the Median Indicator indicates it by forming the purple ribbon. The purple ribbon is formed when the Median EMA has higher value than the Median (the Median EMA is above the Median), when this situation appears, the space between the Median EMA line and the Median line is filled with the purple color.
Below is the image that shows the downtrend information in the Median signal.
Task 5 - Identifying Fake Signals with Median Indicator
As the nature of analysis tools is not perfect, it does not always present the right signal, so it has become a kind of rule among traders to combine several analysis tools to get a more precise picture of market conditions, either by getting confirmation or refutation.
In the following image of screenshotted TradingView’s ETHUSDT 30 minutes price chart we see how the Median Indicator ignores the imprecise signals reported by the Arron Indicator.
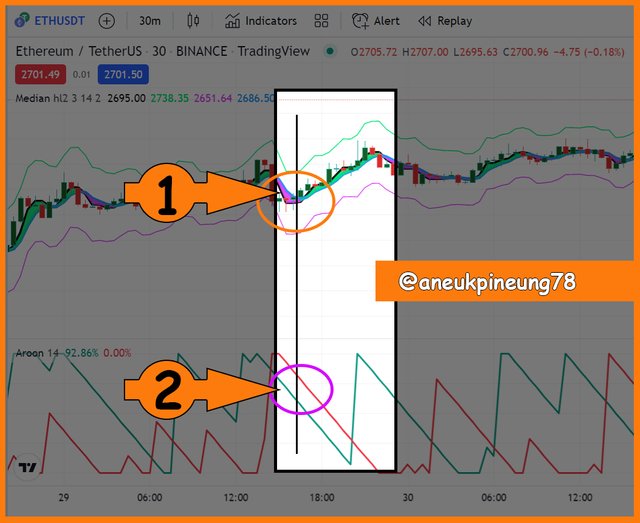
On marker (1) in the picture above it is shown that the Median reported the occurrence of an uptrend while the Aroon failed to report the same thing (marker (2)).
Task 6 – The Demo Trade Using Median Indicator
For the purpose of this task, I used the demo trade facility of TradingView’s, which is called the “Paper Trading”.
6.1. Long Position for Ethereum on USDT Market (ETH/USDT)
For the first demo trade in this assignment I chose to go long on ETH/USDT. On this occasion I combined the Median Indicator with the Aroon Indicator. I use these two technical analysis tools with the default settings. ETHUSDT price chart is set on a 30 minutes timeframe. Take a look at the screenshot from TradingView below.
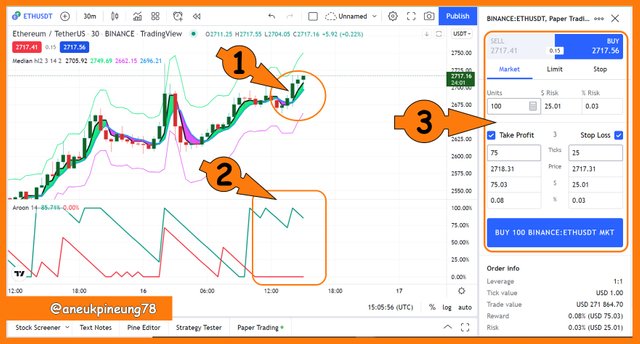
Marker (1) in the image above shows that the Median Indicator reports that an uptrend has just occurred in the ETHUSDT market. Aroon Indicator as shown by marker (2) confirms the signal given by the Median Indicator. I thought I could rely on this information enough and decided to enter the market buying 100 ETH on the USDT market at the market price. I set Take Profit at 75 ticks and Stop Loss at 25 ticks.
The following picture shows that my order has been filled.
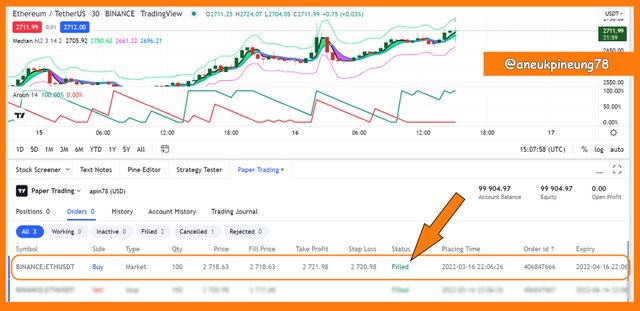
The details of the demo long position for 100 ETH on USDT market I made is as shown in the following table:
6.2. Short Position for Tezos on USDT Market (XTZ/USDT)
For short positions I chose the XTZ/USDT pair. For this task I combined the Median Indicator with the RSI, both with default settings.
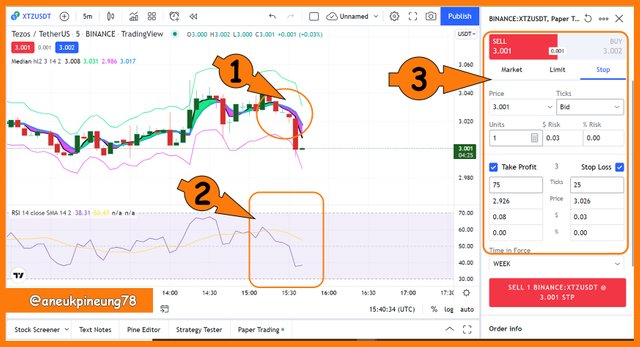
Marker (1) in the image above shows that the Median is delivering a bearish signal for the XTZ/USDT market. The RSI confirms this as indicated by marker (2). I think this is enough signal to exit the market. I placed a stop order to sell 1 XTZ at the price of 3,001 with details as shown by marker (3). My Take Profit and Stop Loss are set by default, at 75 and 25 ticks, respectively.
The image below shows the state of a stop order for a demo short position that I have placed for 1 XTZ in the USDT market.
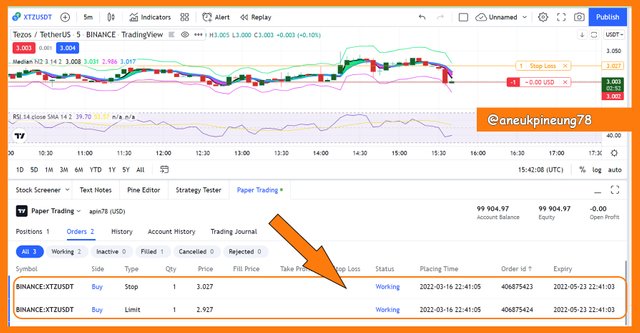
The above image shows that order is in the “working” state, which means it has not yet met the price criteria I set to it. Once it meets the criteria, the sell will be a success.
The below screenshot shows the demo stop order final state, a few hour later.
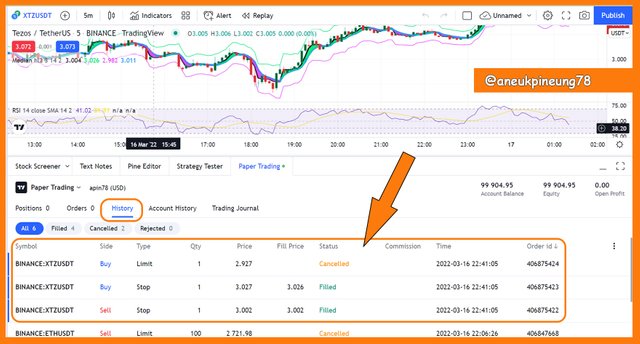
The image above shows this information for the short position stop order I placed on TradingView’s Paper Trading for 1 XTZ:
- The buy was 100% filled through Stop type (so the limit buy was canceled), at price 3.027 USDT.
- The sell was made in the Stop type and was filled at the price of 3.002 USDT.
Thanks
Thanks Professor @abdu.navi03 for the lesson titled Crypto Trading Strategy With Median Indicator.
Pictures Sourcing
- The editorial picture was created by me.
- Unless otherwise stated, all another pictures were screenshoots and were edited with Photoshop CS 3.
Sources and Reading Suggestion
- https://www.tradingview.com/scripts/median/;
- https://www.incrediblecharts.com/indicators/median_price.php;
- https://www.metastock.com/customer/resources/taaz/?p=70
- https://www.tradingview.com/support/solutions/43000644897-median/;
- https://www.fidelity.com/learning-center/trading-investing/technical-analysis/technical-indicator-guide/atr;
- https://www.investopedia.com/terms/a/atr.asp;


shared to twitter: https://twitter.com/aneukpineung78a/status/1504435195210235906.