Crypto Academy / Season 3 / Week 2 - Homework Post for Prof. @reminiscence01
Hello Everyone,
Trust we are all doing great? It's really nice to be here again this new week. Though, It's my first time attending prof. @reminiscence01 class. But to be sincere, I must say I really enjoyed the class. So, am so happy to be one of the participants. Without wasting much of our time, I would go straight, answering the question give to me by Prof. @ reminiscence01.
Explain the Japanese Candlestick Chart? (Chart screenshot required)
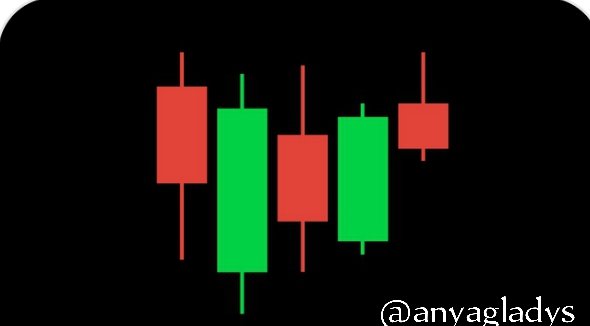
Candlestick pattern is a technical analysis tool, use by traders in order to analysis the market price and the movement of securities. It was developed by a Japanese rice famer, Munehisa Homma. Historically, Munehisa Homma discovered in is research that, rice market was influenced by the emotion of traders, which bring about candlestick.
Candlestick can be graphically displayed in nature. It's displayed the price movements by using different colour to indicate the differences. Candlestick can be use to indentify price pattern and make decisions based on the short or long time direction of prices. The green candlestick shows the upward movement or bullish movement. While, the red signifies the downward or bearish movement of the market.
The green candlestick open it's price from below and closes above and red open it own market above and end or closes below. The wick line above is refers to as resistance while the wick one below is refers to as surpport. The resistance and surport line can be used for market prediction because the trader would know and understand how the market is fluctuating.
Historically, Munehisa Homma was able to dominate the rice market and became popular for discovering the Candlestick chart method because with this pattern, trader's can determine the future price of a market and this attracted many practitioner to adopt the trading parttern.
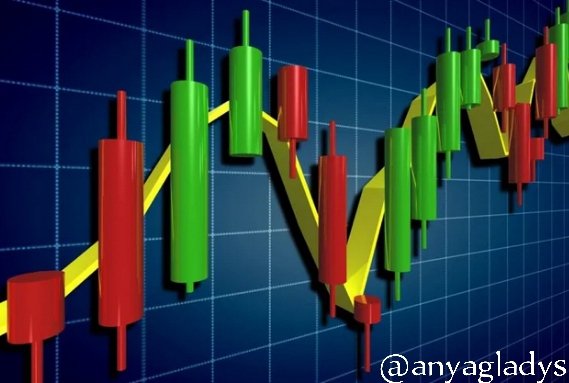
In conclusion, Japanese candlestick is now a popular trading tool used by traders in the whole world, to analysis the financial market. Especially, to predict the future price of a market.
Describe any other two types of charts? (Screenshot required)
Before i start explaining other two types of charts i would like to explain the meaning of a chart. Chart can be define as a graphical representation of data. It allow users to see, understand and predict current and future data.
Chart is one of technical analysis tool used by traders and we have different types of charts. I will be explaining below two different chart apart from Japanese candlestick chart.
Line Chart
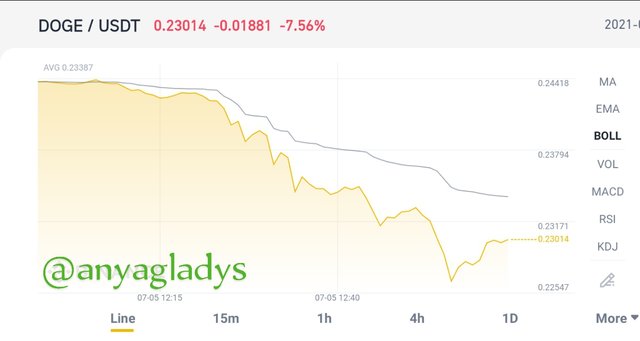
Tradingview of DOGE/USDT
According to it's name Line Chart, Line Chart display in line pattern. It is a type of chart that displays the least amount of data. It is very simple. It only plots closing prices and connects them. It's aslo a type of chart used to show information that changes over time.
It's a type of chart that is used by Traders who do not need to know the price movements of an instrument such as the opening, high, and low prices. The x-axis represents date and time; the y-axis represents the price.
Bar chart
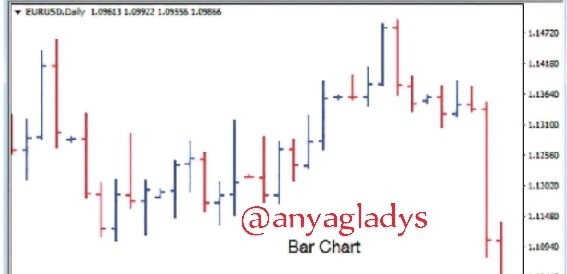
Tradingview of EUR/USD
Bar charts is more complex than line charts. In addition to closing price, they shows high, low, and opening prices. Bar chart vertical lines shows the trading range, and the two horizontal bars connected to each vertical line show the opening and closing prices of currency pairs; the opening price is on the left, and the closing price is on the right.
Historically, Bar charts sometimes refers to as OHLC” charts, for “open-high-low-close.” They provide a more detailed picture of the price movements of a particular currency pair than a line chart.
In your own words, explain why the Japanese Candlestick chart is mostly used by traders.
Japanese candlestick is one of the technical analysis tool, used by traders. Many traders prefer to use Japanese candlestick because it can help them to do determine the current market situation just by looking at the color and length of candlestick. It can help traders to instantly determine if the market is in its bullish or bearish period.
It helps in identifying market patterns very quickly. Candlestick charts display specific bullish and bearish reversal patterns that cannot be seen on other charts.
Also, Japanese candlestick can help trader's to see the direction of the market very easy. The color and shape of the candlestick can also help traders to determine if an Uptrend is part of bullish momentum or simply a bearish spike.
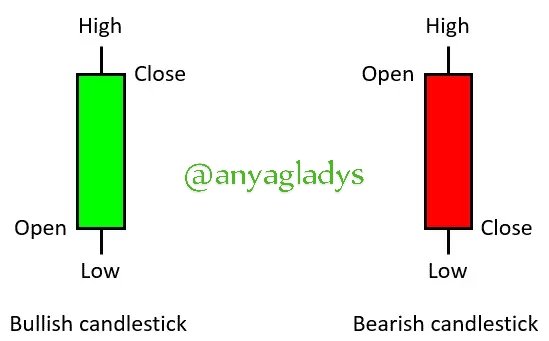
Describe a bullish candle and a bearish candle identifying its anatomy? (Screenshot is required)
_1.webp)
Source
Candlestick chart analysis is an important skills for trader's. It is used to plot prices of financial instruments through the use of technical Analysis. Candlestick body appreance and shadow potentially gives a lot of information about how the market is and where it's going. Candlestick consist of a body and two wicks. It's normally drawn as a rectangle, which marks the opening and closing period.
Candlestick is something that can be predicted. A long body is suggested that the market is directed and traded in bulk or in one direction. While a small body indicate lighter trading.
Also, candlestick chat analysis can be explained by individual candle and there patterns. Which are, the bullish and bearish period. Bearish indicate when there is a fall in the market price. While, bullish indicate the rise of the market price. The main benefit is that, the Candlestick is displayed colourfully. And this allow the trader's to quickly j derstand the differences. The wicks are drawn as two vertical lines above (resistance) and below the body (support). The wicks mark the high and the low that price has achieved for the period.
However, In a bullish candle, the open is indicated by the bottom of the rectangle while the close is indicated by the top of the rectangle. Bearish market is the opposite, with the period's of a closing price falling below the period of opening price.
In Conclusion, candlestick chart is a very important tool in technical analyis and it is also a skill that is very important in determing the future price of a market. I want to say a very big thank you to @reminiscence01 for bring up this topic and to those that will be reading my post.
.