Crypto Academy / Season 3 / Week 3 - Homework Post for Prof. @lenonmc21
Greetings to you all,
It is another opportunity to be here again this season. According to this week's topic "All about Trends, Supports and Resistances and simple chart patterns." I will be answering some questions given by Prof. @lenonmc21 from the aforementioned topic. Please, follow me as I take you on the Journey.
source

Trends
A trend can be defined as a general direction in which something is developing or changing. It is a technique that is used by traders in doing technical analysis and it is based on the idea of something that has happened in the past.
A trend is also an analysis that can be used to predict the future price in trading, such as a bull (bullish or increase) market run and bear (bearish or decrease) market run. Trend analysis is a helpful tool, especially if traders make it their friend, because moving with trends and not against them will lead to profit for an investor or traders. It gives traders an idea of what will happen in the future.
However, trends in the financial market can either be Short-term trends, Intermediate trends, or long-term trends. Trends can be both upward(bullish) and downward (bearish) respectively. Also, there is no specified amount of time required for a direction to be considered a trend. The longer the trend the direction is maintained, the more notable trends.
Roles of Trends in a chart
- Trends helps in drawing trendline. Because, without trend, there won't be a trendline.
- Trends helps traders or investor to predict the future price after when a trend has been discovered.
- Trends serve as the foundation for trendline
Trendline
 Trendingview.com
The trendline is one of the basic tools used by traders in doing technical analysis in a financial market chart. The trendline is a line drawn by traders or investors over pivot highs or under pivot lows to show the direction of price on a chart and also, to connect series of prices or to show data's best fit. The resulting can then be used to predict the future price or direction in which an investment value might move.
Trendlines can also be said to be visible support and resistance in a time frame of the financial market, Which is made in form of diagonal instead of horizontal lines. It shows where the price is heading and the speed of the price. It also describes patterns during the time of price contraction.
Roles of Trendline in a chart
- Trendline serves as one of the basic tools for technical analysis.
- It helps to give a clearer picture of what is going on in the financial market.
- It helps investors or traders to know when the price is heading to.
- It indicates the best fit of data using a single line or curve.
- Trendline can be applied to the high and low of a chart to create a channel.
Trend lines are lines that are drawn from an angle to indicate an immediate trend and indication when there is any change in the trends. It is a line that is drawn at an angle above or below the price. It can also be used as support and resistance and also to know when to open or close a trading position.
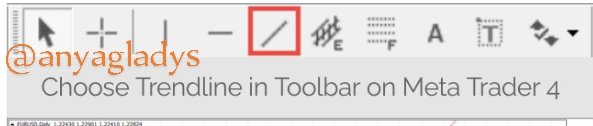
In a trading chat, before you can draw any trendline you need to select or choose Trendline in the toolbar of any trading view of the exchange you are using. An example is a screenshot below.
Source
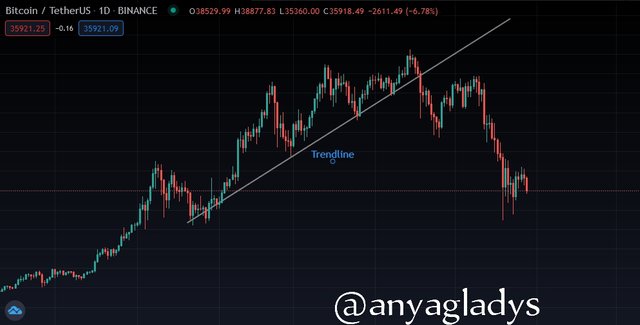
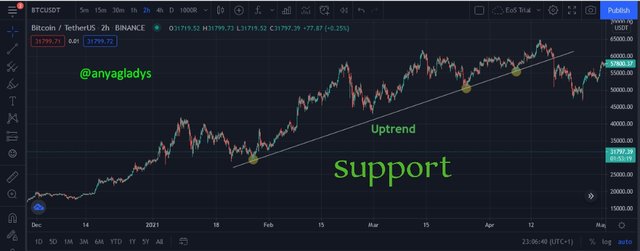
In the two charts below, the first one shows an example of an uptrend line while the second shows an example of a downtrend line.
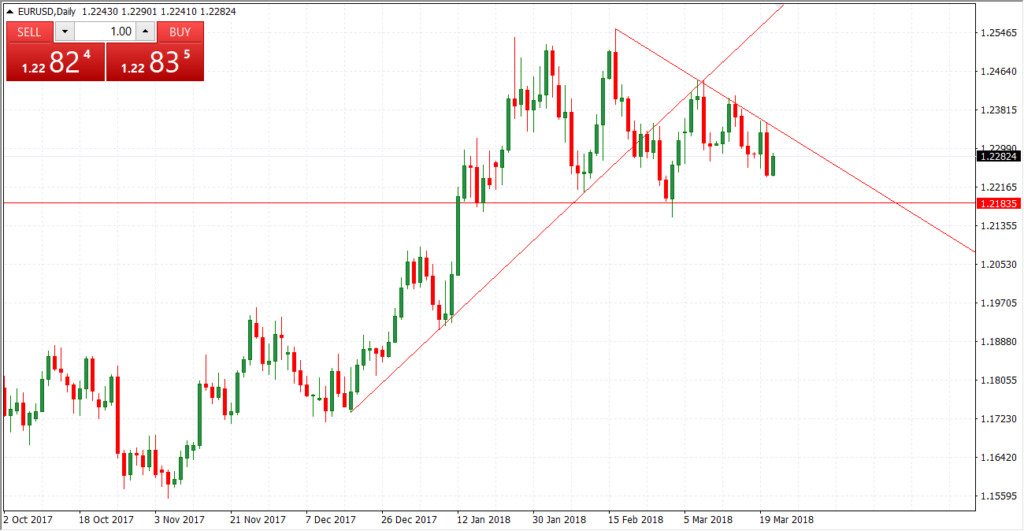
Tradingview.com (uptrend)
Historically, when drawing trend lines in an uptrend traders always draw the line below the price. On the other hand, When drawing trend lines in a downtrend, traders also draw them above the price. Because It is the highs on a downtrend and the lows on an uptrend that will determine a trend line.
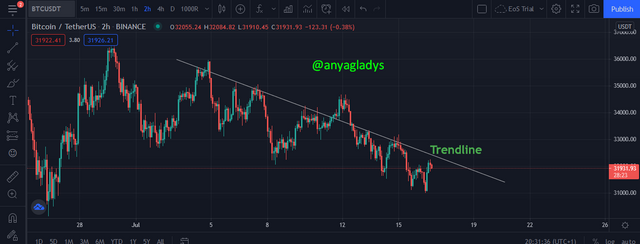
Tradingview.com (downtrend)For your trend line to be valid make sure at least three high or low are used. Historically, the more times the price reaches or touches a trend line, the more valid it is.
Support and resistance level is a very powerful and important concept in technical analysis. They represent the area where we can predict a price reaction of an asset. These two (Support and Resistance) can also be used as a signal used by investors and traders to know when to open or close trading positions.
Support
 Tradingview.com
In a simple term, a Support line can be defined as a level in which prices find it difficult to fall below market price or represent prices where the market had difficulties breaking below. It is a level where many traders make a trading decision, such as accumulating more assets.
However, traders jump into the market when the price approaches an important support level. Because most times, there is always a high number of buy orders located just around important support levels.
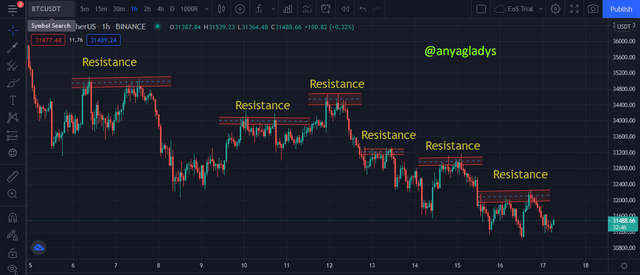
Resistance
 Tradingview.com
Resistance is when the price of an asset moves up and then pulls back, it highest it reaches before it pullback is called "Resistance". Resistance indicates where and when traders will start leaving the market. That is, where there will be a supple or many sellers.
In a simple term, resistance represents the price level at which the price had difficulties in breaking above. Traders also rush into the market when the price reaches an important resistance level after when the future price has been predicted.
How we can identify both zones (Support and Resistance)
Technical indicator
In a trading chart, there is some reliable indicator that can help traders identify support and resistance level. Support and resistance indicators such as Fibonacci tools, moving average, and pivot points are one of the most common to identify supply and demand zone at a specific interval and timeframe.
Historical data
Historical data and price patterns can help traders in identifying support and resistance. A better understanding of the history of data gives a better understanding or helps to identify support and resistance. So that traders will be able to identify when it repeats itself. It is also very important to know that historical data is not always a reliable source to identify support and resistance because a change may occur. Also, knowing the past support and resistance level can be a level as a marker to enter or exit the trade.
General rules
General rules are another way we can identify support and resistance. Some general rules say to identify support, traders draw a straights line from a bearish reversal point and if the line connects to at least 3 reversal points, that is when the line can be considered valid historical support. While identifying resistance, traders connect all the reversal points to draw a straight line and If the line connects at least 3 points, then it becomes a valid historical resistance.
 Tradingview.com
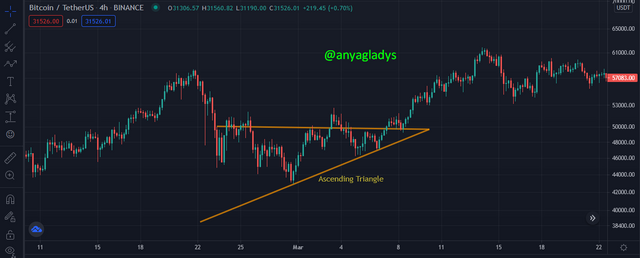
Asending Traingle
Ascending Triangle is an example I an example trading chart pattern, it occurs in a chart when resistance is limiting or does not allow the price of the assets to move more upward. As we can see how candlestick displays the high and low, it shows that the price pressure has increased.
However, the pattern strongly indicates that the market is moving higher as the higher lows are forming heading toward the resistance line. It's also a pattern that indicates the strength of bulls and are willing to buy more.
 Tradingview.com
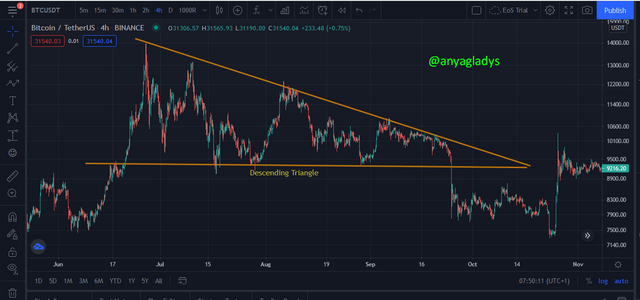
Desending Traingle
Defending traingle as the word implies, is an opposite of Asending triangle. It occurs when the support does not allow the prices of the securities or assets to move downward. The lower high gives a strong indication that selling pressure as increased and is moving lower as the lower highs are formed hearing towards the support line.
In conclusion, Desending triangle is an opposite of an asending triangle because, Desending triangle, indicate the strength of bear and they are willing to sell more. While Asending traingles shows the strength of bull and willing to buy more.
I want to use this medium to say a very big thank you to Pof @lenonmc21 for the wonderful topic. I read and understood the topic and it as really added to my knowledge. Also to those that will be reading homework,