A moving average is used as a technical analysis tool to identify trends and predict future prices. The basic steps for using this indicator are:
There are a few things to consider when using a moving average. First, make sure you select a time period that is long enough to capture meaningful data but short enough so that trader can actually analyze the data. Second, be sure to choose a closing price that is representative of the entire time period being used for the moving average calculation. Third, make sure you keep track of the number of days used in each moving average calculation so you can accurately calculate the new moving average. Finally, be sure to use a moving average that is appropriate for your investment strategy. For example, if you are using a moving average to predict future prices, use a shorter time period and a higher closing price. If you are using a moving average to identify trends, use a longer time period and a lower closing price.
There are three different types of moving averages that are:
Simple Moving Average ,Exponential Moving Average and Weighted Moving Average i will explain each one in detail.

The simple moving average is a calculation used to smooth out the fluctuations in historical prices. The simple moving average is calculated by taking the sum of the closing prices for a given number of days and dividing it by the number of days in that period. Simple moving average helps the traders to identify short-term trends in the market.

The exponential moving average is a more accurate calculation than the simple moving average because it takes into account the short-term and long-term fluctuations in price. The exponential moving average is calculated by taking the sum of the closing prices for a given number of days, dividing it by the number of days in that period, and then multiplying that sum by a certain factor. The exponential moving average helps the traders to identify long-term trends in the market.

The weighted moving average is a more accurate calculation than the simple moving average and the exponential moving average because it takes into account the size of the company. The weighted moving average is calculated by taking the sum of the closing prices for a given number of days, dividing it by the number of shares outstanding on that day, and then multiplying that sum by a certain weighting factor. The weighted moving average helps traders to identify trends in the market and get insights of the buy/sell direction.

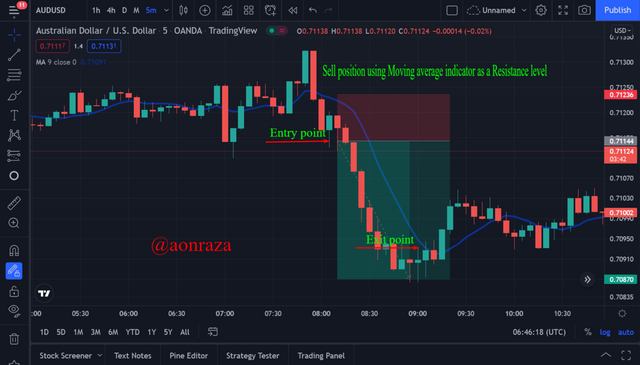
In Moving average graph , traders look for entry and exit points. Entry point is the point where the moving average crosses over the current price, while exit point is the point where the moving average falls below the current price. Moving averages help to identify short-term trends in prices and can be used as a tool to find entry and exit points in markets.
.png)
Source

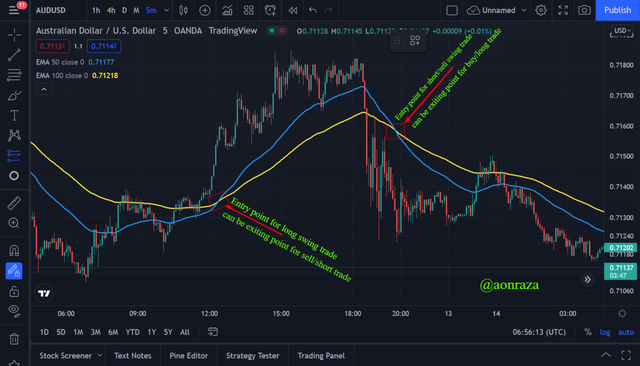
A crossover is a technical indicator that is used in order to identify the trend in a security. When the moving average crosses over the price of the security, it indicates that the trend is up and therefore, investors may want to buy into the market. Conversely, when the moving average falls below the price of the security, it indicates that there is a down trend and therefore, investors may want to sell off their holdings. These buy or sell predictions are used to create buy and sell orders in the market.
.png)
Source

Not suitable for long-terms trends: Moving averages can be useful in identifying short-term trends, however they are not always accurate and do have some limitations. For example, moving averages can only identify trends for a certain period of time so if the security price moves quickly, the moving average may not be able to capture this movement accurately.
Distortions with quick moving's: Moving averages can sometimes become distorted when prices move rapidly. For example, if a security's price moves up and then falls back down very quickly, the moving average may not be able to capture this movement accurately. As a result, the average may appear to be unchanged when in fact it has shifted.
No rule of thumb to select a time-period: Moving averages are not a rule of thumb and there is no one specific time-period that is always best. Instead, it depends on the security's characteristics and how quickly prices are moving. Every trader has to put on these time-periods as their own understanding of the security and the market.

In trading no one is certain of the market fluctuation direction, traders have been using different indicators that are built by expert with their years of experience, knowledge and observations these indicators will help traders to make informed decisions. One such indicator is Moving averages is a technical indicator that helps traders to quickly and precisely predict the upcoming buy/sell trends in the market. This indicator has other types that have their different uses and makes up to the ease of the trader. But no trader will rely on any one of the indicator before making a decision, because there are other factors like time, crypto pair and market dynamics traders need to consider.


.png)

.png) Source
Source

.png)

.png)


