Double Top and Wedge Trading - Crypto Academy S6W2 - Homework Post for @imagen

Hello guys, today I'm gonna share my knowledge about the double top, double bottom and wedge patterns in trading. And in guidance of the excellent lecture of @imagen
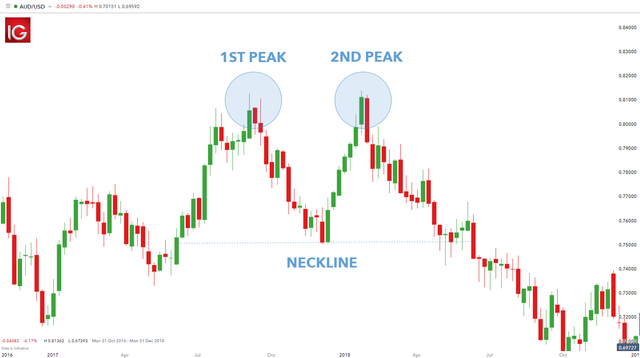
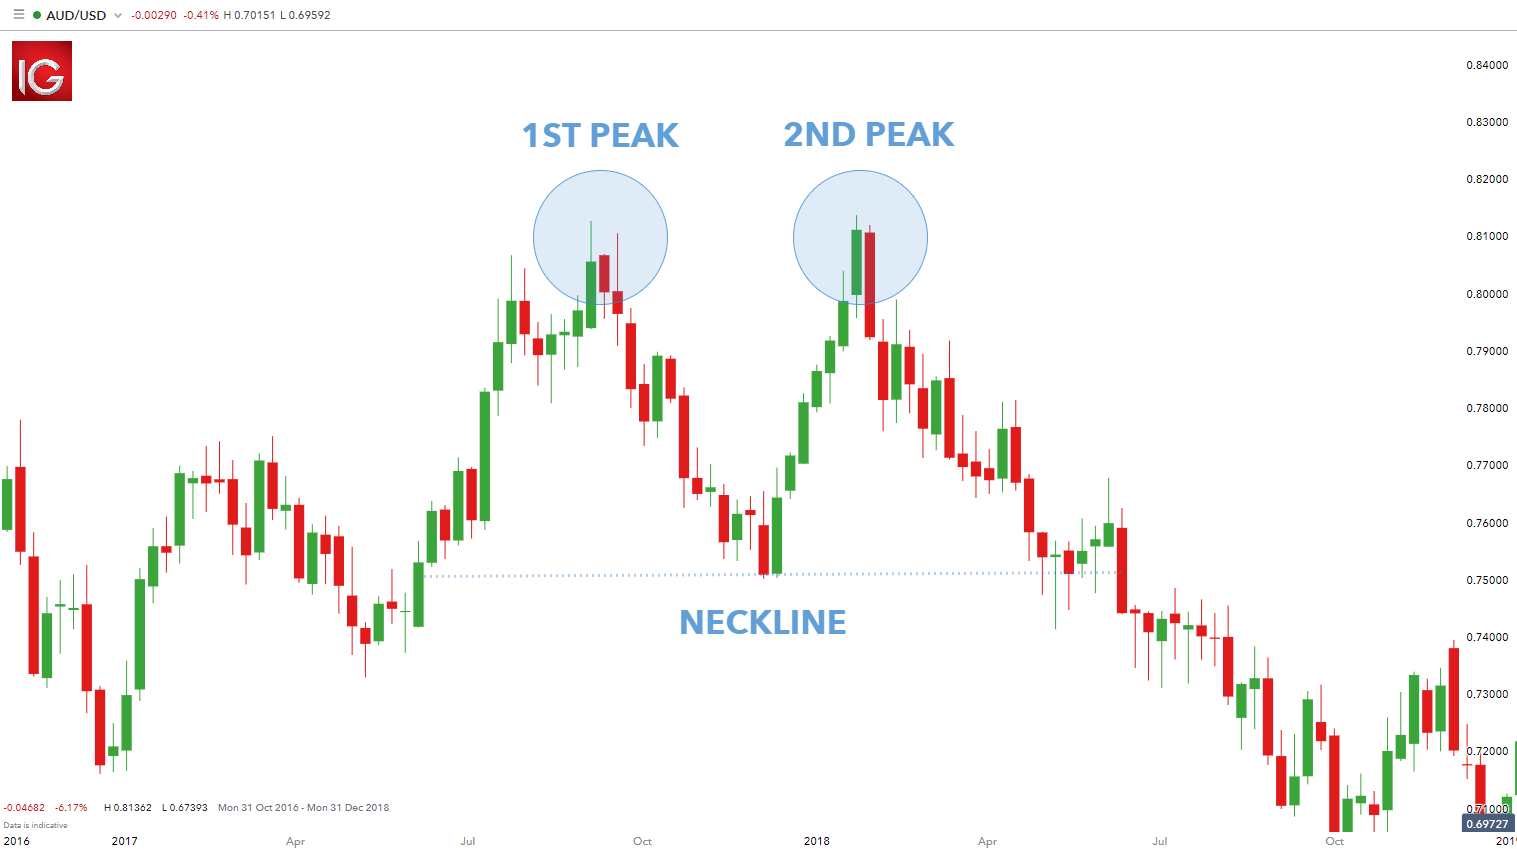
The concept of double top, double bottom and wedges refers to a chart pattern that is formed when two identical price peaks are reached within a brief period of time. This pattern signals the possibility of a price decline, as investors may start selling off assets in anticipation of a fall.

A double top is the first formation of the pattern, and refers to the occurrence of two consecutive price peaks. In order for this pattern to be identified, there must be two separate points at which the price reaches its highest value. The second peak will usually be lower than the first, and indicates that the price is starting to decline.

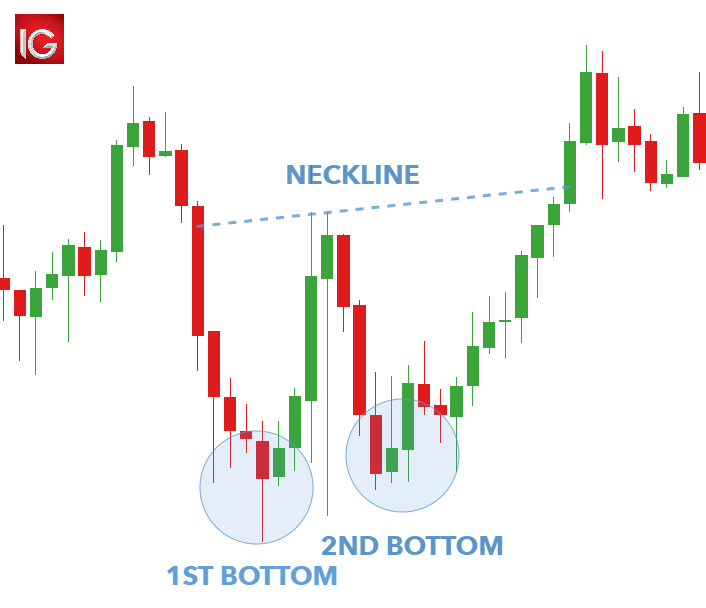
A double bottom is the second formation of the pattern, and refers to the occurrence of two consecutive price troughs. In order for this pattern to be identified, there must be two separate points at which the price reaches its lowest value. The second trough will usually be higher than the first, and indicates that the price is starting to rise.


A wedge is a type of chart pattern that forms when two prices are close to each other but not exactly equal. The price of the asset will slowly move towards the higher value, while the price of the asset will slowly move towards the lower value. This pattern can indicate a potential reversal in the market, as investors may start to buy into the asset again after seeing it fall for a period of time.

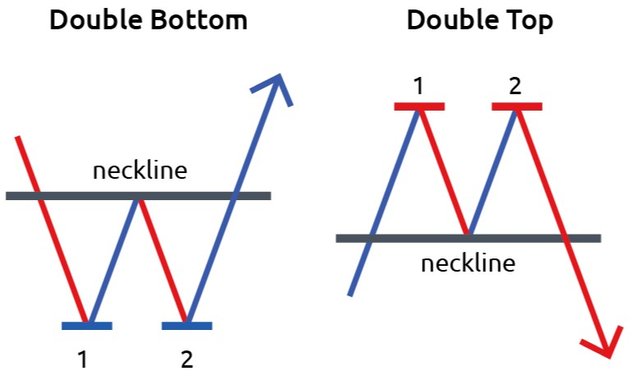
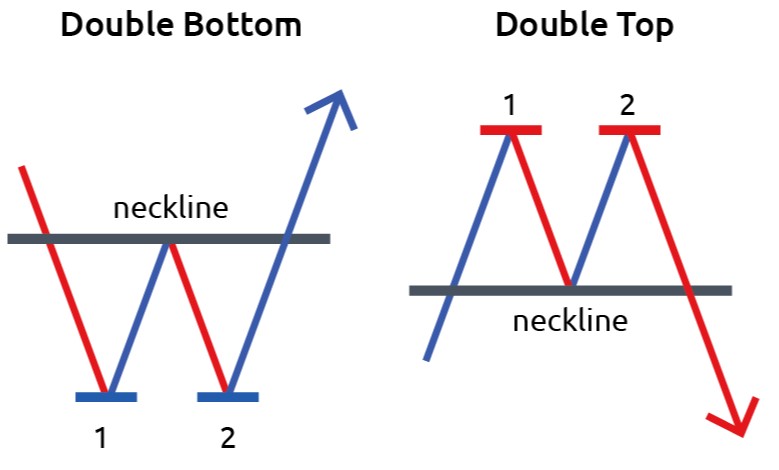
The Double Top is the first formation of the pattern, and refers to the occurrence of two consecutive price peaks. In order for this pattern to be identified, there must be two separate points at which the price reaches its highest value. The second peak will usually be lower than the first, and indicates that the price is starting to decline.
Meanwhile for the Double bottom formation , there must be two separate points at which the price reaches its lowest value. The second trough will usually be higher than the first, and indicates that the price is starting to rise. differences between them are as following:
- Double top is a Bearish pattern while double bottom is a Bullish pattern.
- The Double top is a reversal pattern while the Double bottom is not.
- The Double top occurs after a price peak, while the Double bottom does not necessarily have to occur after a price peak.
- The Double top is more common than the Double bottom.
A bullish wedge is a pattern that is formed when the price of a security begins to move higher and then falls slightly, signaling that buyers are back in the market. Meanwhile, a bearish wedge is a pattern that is formed when the price of a security begins to move lower and then rises slightly, signaling that sellers are back in the market.
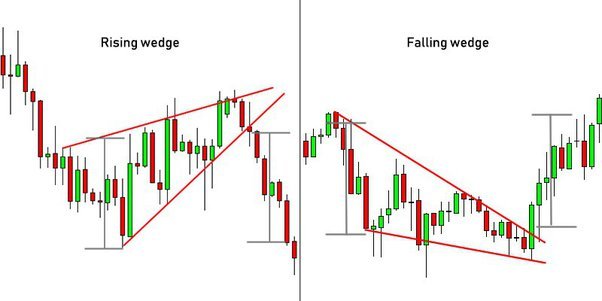
The main differences between these patterns are as follows:
- A bullish wedge occurs after a price peak while a bearish wedge does not have to occur after a price peak.
- A bullish wedge is more common than a bearish wedge.
- The height of the wedge may be higher or lower than the height of the previous price peak, but it always has two distinct points at which prices reach their lowest value.
- The formation of a bullish wedge is considered to be a positive signal by market participants, while the formation of a bearish wedge is considered to be a negative signal.
During the formation of the wedges volume of the wedge keep decreasing as you can see in the above images. There is more congestion while the price keep moving towards the apex of the triangle formed by two divergent lines of bullish or bearish behavior. From this we can determine that there is more volume in the start or during the making of the wedge or we can also say that there is as more volume as the price is away from the apex of triangle. when the price pulls back and break the support of the wedge the the new price is found at the lowest point within the wedge. This point can be the best point for exiting the sell trade.
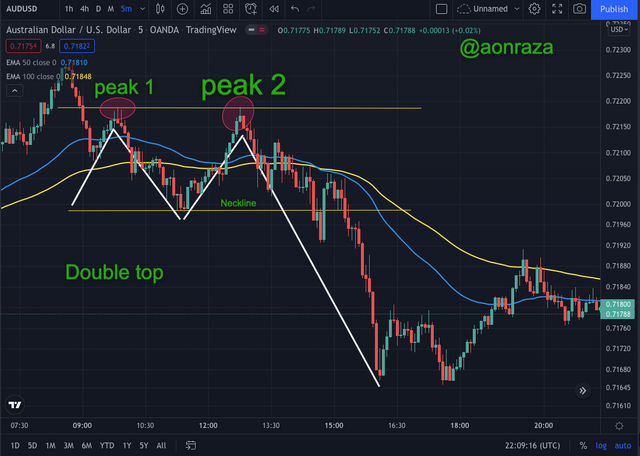
I found a double top on AUDUSD pair forming the peaks on the price of 0.722 then a major drop of price to 0.716.
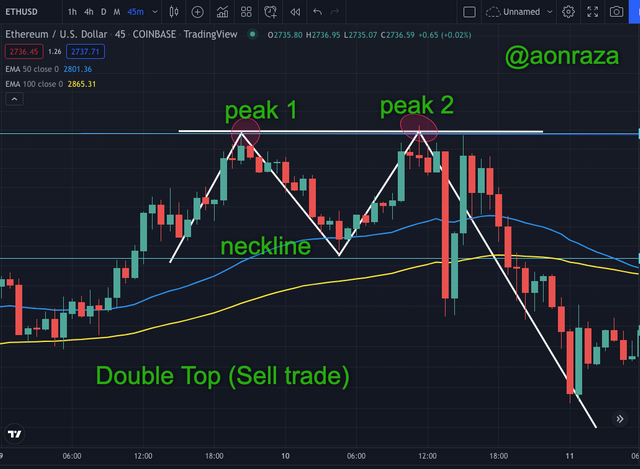
Secondly, i fount a double top pattern on ETHUSD chart with details shown below.
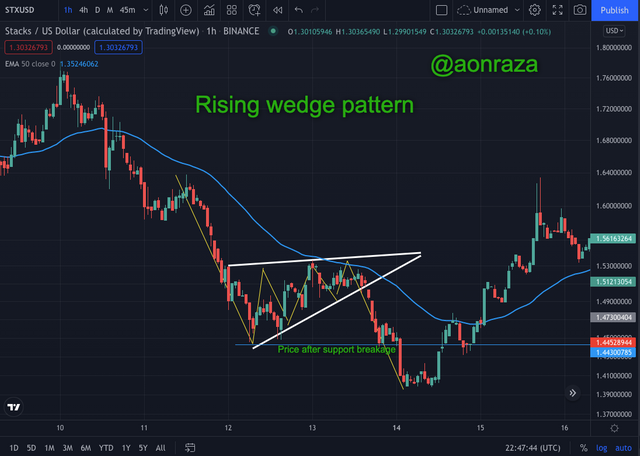
Following is the Rising wedge formed on STXUSD pattern with the breakout price indicated.
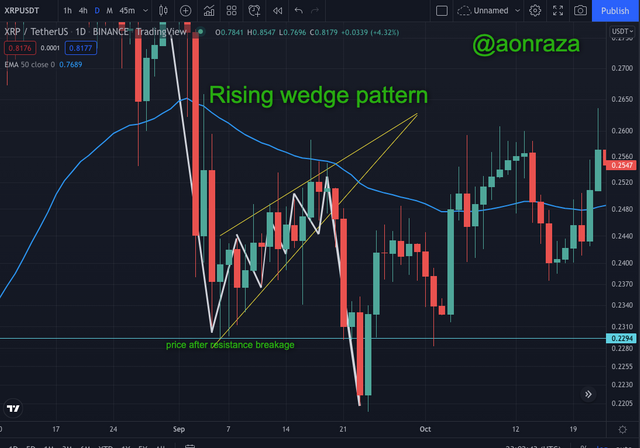
Secondly, the rising wedge in RIPPLE/DOLLAR chart with price after resistance breakage indicated.
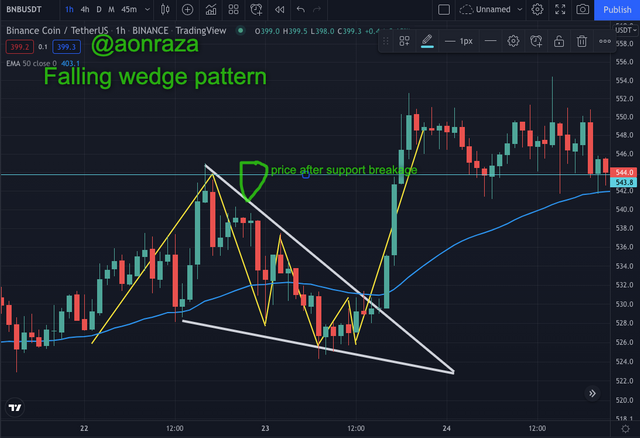
Now, here is the falling wedge demonstration of exceptionally growing BNBUSDT Pair of cryptocurrency'
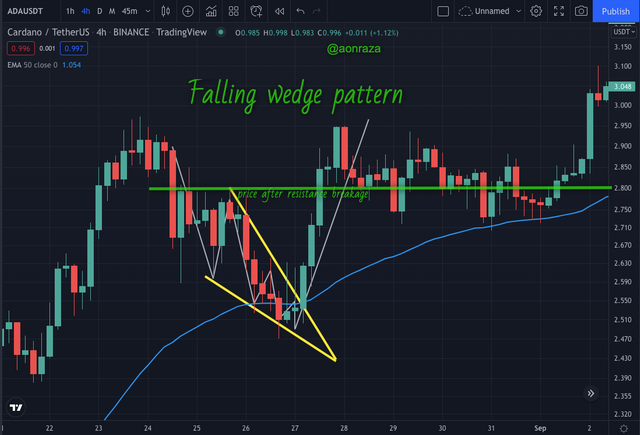
The last example is of Cardano (ADAUSDT) forming a falling wedge. Demonstrated below.

The importance of patterns in technical trading cannot be overstated. Patterns can provide traders with an indication of the overall sentiment of the market and can help them make better investment decisions. For example, a bullish wedge pattern is often considered to be a positive signal by market participants, indicating that buyers are back in the market and that prices are likely to continue moving higher. Meanwhile, a bearish wedge pattern is considered to be a negative signal by market participants, indicating that sellers are back in the market and that prices are likely to continue moving lower. By understanding the importance of patterns and using them as a basis for trading decisions, traders can significantly increase their chances of success in the stock market.

Patterns in the trading are a great tool for traders to make informed decisions about the market. No trader could succeed in the market without having to apply the knowledge and information received through experience, education, and patterns. Patterns can provide traders with an indication of the overall sentiment of the market and can help them make better investment decisions. For example, a bullish wedge pattern is often considered to be a positive signal by market participants, indicating that buyers are back in the market and that prices are likely to continue moving higher. Meanwhile, a bearish one goes opposite to the bearish one. This indicates that sellers are back in the market and that prices are likely to continue moving lower. Using patterns in the trading will save effort and time of a trader and decisions made based on patterns are more likely to succeed than those made without them.

Whenever it comes to trading no matter crypto or forex we always use some patterns to analyze the future prices. Double top and double bottom technique can give you some clues and sometime it can give perfects results but due to the volatility of the markets the patterns are deemed as a wrong signal sometimes. All the patterns have their own pros and cons. Like wedges we can have good idea of the exiting price or the time to close trade. And for double top and bottom are effective for the swing trades. There is a great risk involved in trading. So, it is recommended to use more patterns to omit the false trades or wrong prediction.
Thats all for today. Thank you @imagen for guiding us with the great lecture.
@imagen post has reached its 5th day, haven't got curators vote yet.
Gracias por participar en la Sexta Temporada de la Steemit Crypto Academy.
Espero seguir corrigiendo tus futuras asignaciones, un saludo.