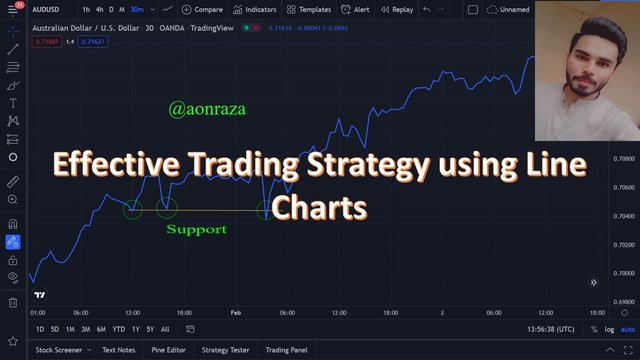
Effective Trading Strategy using Line Charts -Steemit Crypto Academy | S6W1 | Homework Post for @dilchamo
Hello everyone i am glad to participate in this season of Crypto academy i am willing to learn a lot of new things from all the professors and put forward my knowledge in the trading market. I am open for constructive criticism and would love your feedback.
A line chart is a graphical representation of price movements. Line charts can be used to display the price action of an asset, over time, on a single chart. Line charts are plotted on a coordinate plane, usually shown as x-axis on the left side of the chart and y-axis on the right side of the chart. The vertical axis represents time and each point on the line chart corresponds to a specific price point in that timeframe. Here these price points are connected by line segments. The length of these line segments corresponds to the magnitude of the price movement at that point in time.
Uses of line charts
- Display the price action of an asset over time: This is really a simple and easy to determine graph which gives information about the price changes over time by eliminating the inner details(Noise)
- Compare the performance of different assets against each other: By plotting the price movement of different assets over time, you can get a better understanding of which asset is being the great at a provided point on time
- Identify significant price movements: By analyzing the line chart you can identify when there was a significant price movement and what caused it.
- Predict bearish and bullish trends: The line chart can be used to determine when a bearish or bullish trend is starting or ending
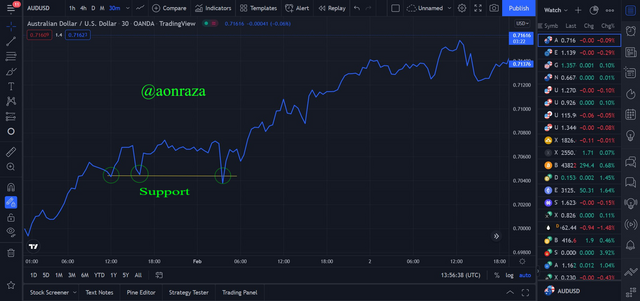
To find the Support in the Line Chart use the horizontal or vertical lines as boundaries to identify points at which the line seems to hesitate or drop downwards. This may be an indication that support exists at this point and that it is worth investigating further. Look for areas where the line appears to be flat or stable. This may indicate that support is present at this point and that it is worth investigating further.
.png)
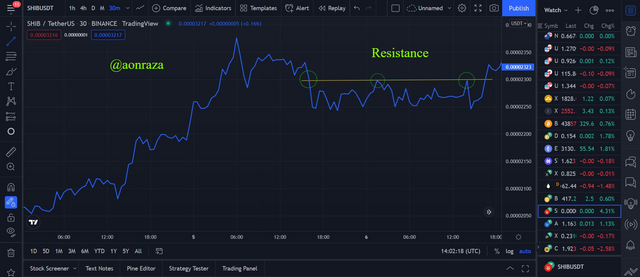
To find the Resistance in the Line Chart, the horizontal or vertical lines as boundaries to identify points at which the line seems to hesitate or rise upwards. This may be an indication that resistance exists at this point and that it is worth investigating further. Look for areas where the line appears to be flat or unstable. This may indicate that resistance is present at this point and that it is worth investigating further.
.png)

Candlestick charts are used to display the price action of an asset over time. They show the open, high, low and close prices and direction of movement for each day. Candlestick charts are useful for analyzing short-term movements. While the Line charts shows the price movement over time, they can be used to analyze asset performance, and are used to identify significant price movements. Other major difference between them is Line charts can be used to determine when a bearish or bullish trend is starting or ending.
Both line graphs and candlestick charts can be used by traders to help them understand the market. Line graphs are ideal for higher time-frame analysis, while candlestick charts provide more detailed information about price movement. When making trading decisions, such as stop-loss distance and location, the information from both types of charts can be useful because both have a tendency to provide accurate information.

Line charts can be used with other indicators to guess the next bearish or bullish trends for upcoming trades.
Moving Average
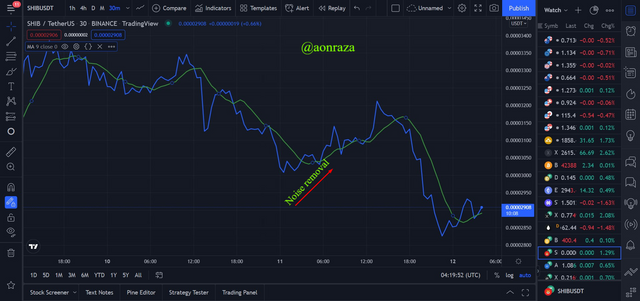
A moving average helps to smooth out the data so that it is easier to see trends. This will give better insight into the overall trend of an asset. As when analyzing a trade we often get distracted by the noise and pay greater attention to the smaller and negligible details and distract from potential information this combination help get rid of the Noise and help us get better insight into the graph.
.png)
As we can see in here in the above image that using moving average along with the Line Chart and helped us to get rid of the noise that was a big distraction and now we can analyze the graph with better insight.
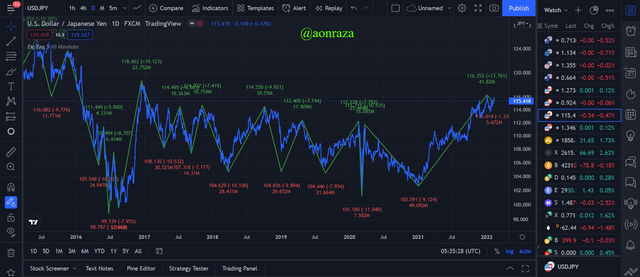
Zig Zag
We can use zig zag indicator along with a line chart to predict upcoming bullish or bearish trends. The trend sheet that I usually follow is:
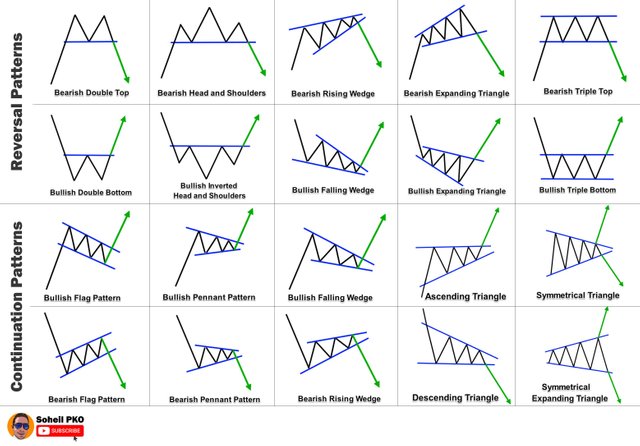
By using the above given zig zag patterns we get to see the bigger and clear picture of the trades and predict accurately. The predictions made are easy to understand, also there are predefined patterns which reduces the effort of trader.
.png)
Bullish trade is when you buy a security with the hope that its price will increase in the future. Bearish trade is when you sell a security with the hope that its price will decrease in the future.
Bullish Trading opportunity
A bullish trading opportunity is signaled when a security's price rises and then breaks above an overhead resistance level. This indicates that the buyers are in control of the market and that the security is likely to continue to rise. During the Bullish Trading opportunity, you should sell short if the security's price falls below the support level at which you bought it and wait for it to rise above the resistance level again.
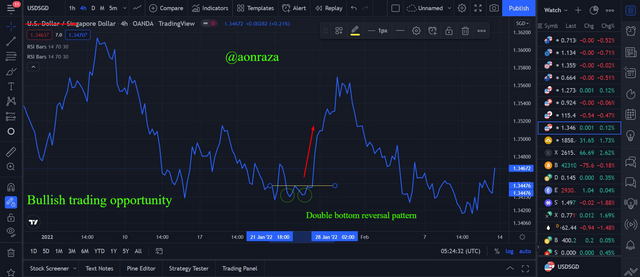.png)
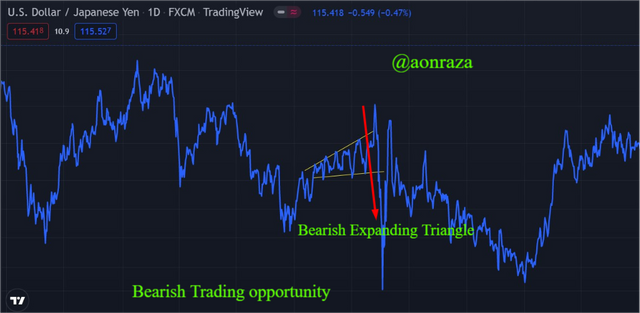
Bearish Trading opportunity
A bearish trading opportunity is signaled when a security's price falls below an overhead resistance level. This indicates that the sellers are in control of the market and that the security is likely to continue to decline. During the Bearish Trading Opportunity, you should buy short if the security's price rises above the support level at which you sold it and wait for it to decline below the resistance level again.


.png)
Linecharts are an effective tool for visualizing and understanding complex financial data. They allow traders to more easily see patterns and relationships in the data, making it easier to make informed trading decisions. Additionally, linecharts can help analysts and traders track progress over time, helping them identify areas of improvement or success.
When analyzing Linechart itself we see them providing the following advantages to the traders:
- They provide a visual representation of complex financial data.
- They allow traders to more easily see patterns and relationships in the data, making it easier to make informed trading decisions.
- They can help analysts and traders track progress over time, helping them identify areas of improvement or success.
- They are an effective tool for visualizing and understanding complex financial data.
- Line charts can help analysts and traders track progress over time, helping them identify areas of improvement or success.
Linecharts may sometimes be very complex to understand if they're considered and analyzed at their entirty. This complexity may cause some traders to struggle to understand them, making it difficult to make informed trading decisions. Additionally, linecharts can be time-consuming to create, which may limit their usefulness in busy trading environments.
They have following disadvantages:
- They can be very complex to understand if they're considered and analyzed at their entirety. but this complexity can be resolved if we use some other type of indicator which will make it understand better.
- They can be time-consuming to create, which may limit their usefulness in busy trading environments.
- They can be difficult to interpret if they're not used in conjunction with other indicators.
- These charts if noticed for little time intervals noise can be shown as the indicator itself and traders may confuse that noise with trends.
- They may not be as effective in tracking long-term trends as other chart types.
There is no doubt that line charts are an extremely useful indicator when it comes to crypto trading. They provide a concise visual representation of the trends in a given market, which can help you make more informed decisions about your investments. They have their own advantages over other types of charts and should be used in preference to them whenever possible.
One of the main benefits of line charts is that they are easy to read even for beginners. They also make it easy to spot patterns and trends, which can help you make more informed decisions about your investments. They provide the users to use them in combinations with other patterns to accurately and precisely predict the future movements of the markets.
Sort: Trending
Loading...