[Basics to trade cryptocurrencies correctly, Part 1] - Crypto Academy / S6W1 - Homework post for professor @nane15

Hello everyone, welcome to another week of the Steemit crypto academy. In this weeks lesson, professor @nane15 discussed about Basics to trade cryptocurrencies correctly and after going through the lesson notes and with some research, I have decided to attempt the assignment tasks given. Below is my entry;
Question 1: What do you understand by trading? Explain your understanding in your own words.
Trading as we all know is an essential part of our daily lives and we perform trades almost all the time. It usually involves the buying and selling of items, commodities and assets either with the exchange of money or another item. In the central system trading is usually completely with the payment of cash/money and the items purchased are usually at fixed price which do not change over longer period. But with regards to the crypto market, one can acquire a crypto asset at less cost with either cash or with another cryptocurrency and the price of the crypto asset is usually lower at the purchasing period which further increases to accumulate profits for the buyers.
In the crypto market, the prices of crypto assets are usually dependent on the supply and demand of that particular assets. To explain further, prices of crypto assets are seen to on the decline, when many traders continue to sell their possessions of that particular asset. This hard sales on the asset causes a gradual decrease in the value of that crypto asset until there’s a change in direction of price movement of that asset. The price of the crypto asset is seen to be on an increase, when there’s constant purchase of that asset in the market causing a gradual increase in price of the asset over a period of time. The constant change in prices of crypto assets makes it very unique in reference to price volatility of crypto assets.
Due to price volatility of crypto assets, it is very necessary to develop a way in order to take advantage of the price volatility into making more profits from the market and reduce losses. Normally, to start any trading in any of the cryptocurrencies, traders are recommended to buy these assets when the price is low or on the decline. This is what we call the downtrend/bearish trend, in this period prices of the asset is very low and you’re sure of making profits after purchasing. Immediately the price of the asset starts to increase again, the traders are able to take out profits by selling their assets. The increase in price of the asset is called uptrend/bullish trend. For example since STEEM is low at the moment with a price of around $0.38 it is very advisable to buy more Steem and wait patiently for a price increase. So immediately the price of Steem goes up to at least $0.80 you can sell your Steem tokens and make profits.
Also what traders should note is that, it is not always guaranteed that the price of the asset will increase. The price of Steem may further decrease and you should be prepared to take some loss or wait patiently for a price increase.
For one to be very successful in trading in the crypto market, it is required you perform very good analysis before starting the trade. This will help the trader to know the direction of the current market trend and be able to establish a proper market position and make more profits from trades. Some of these trading analysis are;
Fundamental Analysis
This type of analysis requires traders to gather information about the particular asset he/she wants to trade in such as news, policies and reputation of the assets before investing in that asset. After making research about these areas, you’ll be able to know some of the exchanges the assets is listed, the price of the asset and future improvements of the asset. Then you’ll be able to make proper conclusions and analysis to prevent scams or loss in investing in such assets.Technical Analysis
This is the second analysis that is usually perform after the fundamental analysis to further help you make the right decision before investing in the asset. Technical analysis requires the usage of indicators, strategies and patterns on an asset graph to over and predict the movement of that asset. This can also be termed as price forecasting which helps you to make the right market decisions in order to bring in more profits.

Question 2: What are the strong and weak hands in the market? Be graphic and provide a full explanation.
As I mentioned earlier, the price of the asset in crypto market is hugely affected by the supply and demand of that asset which causes high and low volumes of the asset in the market. As a result of this when larger amounts of funds are invested into this assets, the prices are hugely affected and the withdrawal of these funds equally affect the price of the asset.
So with this, the effect experienced on the price of the asset is grouped into two(2) which is the Strong and Weak hands
The Strong Hands are basically large organizations, group of people or even high profile individuals who have pumped more of their financial assets/funds into the particular asset. As a results of this, their market decisions which is buying and selling of the assets greatly affects the price movement of the asset. The. Strong hands on effect on the price movement is done in two phases; the accumulation and distribution trade executions and this causes either price increases or decrease.
Whenever the price of the asset goes low, these strong hands tend to pump huge amount of capital into the asset which is done in the accumulation phase, causing a rapid increase in the value of the asset. This is basically achieved as a result of a demand in the asset and price of the moves up causing an uptrend. After a certain asset price is achieved, they take out some of their investment to make some profits. The period of distribution is when the strong hands start taking out huge amounts of capital from their profits and this causes a gradual decline in the value of the asset.
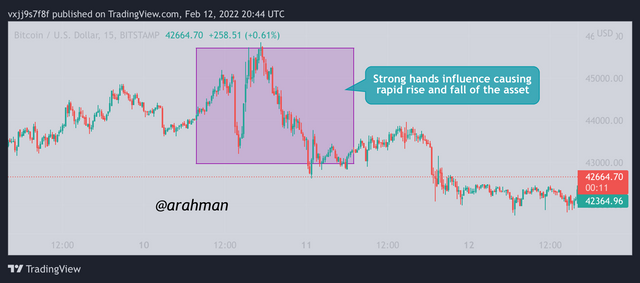
Chart showing effects of strong hands
In the chart above, it can be observed that the price of the asset starts from a low value. So after some time, strong hands inject some huge capital into the market causing the price of the asset to higher gradually. After the price has reached a higher point, it is observed that the price of the asset is now in the decline and this is caused by strong hands taking out their profits and investment from the market.
The weak hands on the other hand refers to the category that have small impact on price movement of an asset. Majority of the crypto market population is made up of weak hands and they contribute little into the market as compared to that of the strong hands.
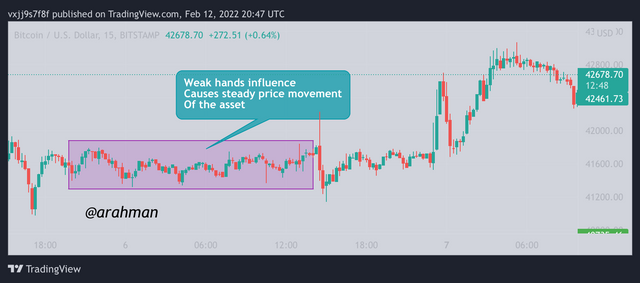
Chart showing effect of weak hands
In the chart above, it can be observed that there is just small changes occurring in the price movement. The price of the asset moves at a steady pace.

Question 3: Which do you think is the better idea: think like the pack or like a pro?
From what I have observed in recent occasions, thinking like a pro is the best. And my reason is that, when you follow the pack, you tend to miss out on certain signals that are required of you to either exit the trade or enter the trade. Now, many of these strong hands have the power to manipulate the market in their favor to make profits. So usually they come up with publicity of an asset and inject a lot of capital into and when they realize that many people have joined them, they take out their profits and leave the pack stranded.
Now when you think like a pro, you’ll be able to perform some technical analysis and therefore observe signals of forthcoming bullish and bearish trend. Then you’ll be able to set up a trailing stop loss and take profits. This way you’ll be able to accumulate more profits before the strong hands take out their investment and causing the price of the asset to fall. So finally I would like to say again that thinking like a pro is the best.

Question 4: Demonstrate your understanding of trend trading. (Use cryptocurrency chart screenshots.)
When we talk about trends in trading, it simple refers to the the direction of price movement in the market. We all know the price of an asset either falls/decreases over a period of time or it increases/rises over a timeframe. These price movement are referred to as downtrend and uptrend respectively and this is basically what is meant by market trends in trading.
To further note explain trends in trading, the use of the Elliot wave theory comes with a great importance.
The Elliot wave is made of 5 waves namely the impulse waves and 3 corrective waves which comes to help traders to identify repetitive chart patterns. Consider these 3 rules below to obtain accurate results from the Elliot wave theory:
The Second wave can’t fall below the start of wave one
The third wave can be the longest wave but not the shortest among the waves.
The price of wave 4 should not enter the price of wave
Wave theory illustration
In the chart above it can be observed that , the rules of Eliott wave are all being satisfied, where wave 2 does not move above the lower point of wave 1. Also wave 3 is larger than wave 1 and wave 5. And finally , wave 4 did not move below the low point of wave 3.

Question 5: Show how to identify the first and last impulse waves in a trend, plus explain the importance of this. (Use cryptocurrency chart screenshots)
As I mentioned earlier, for the trader to benefit from this theory it is essential to identify the first and last impulse of the wave in order to gain more profits from the trade. As a result of this, the trader is now able to spot the buy signals and sell signals very early which makes it possible to avoid losses and maximize profits.
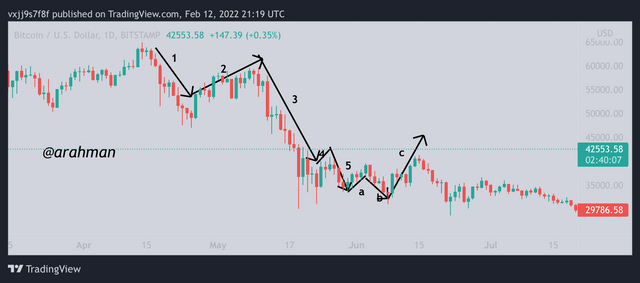
In order to be able to identify the first impulse, you must first all draw your wave lines up to the 5 wave. When the market trend is in a downtrend, where wave 5 points downwards there is a believe that that profits can be made by holding on to the assets since the market will move in a uptrend until the trend starts to reverse by wave a,b and c. Lookin in the chart, it can be observed that the peak of wave C is higher than that of a (the first corrective wave). As a result of this action, it is observed that a new trend is formed and this is called the first impulse. Basically this is how the first impulse is formed and it is shown in the chart below;
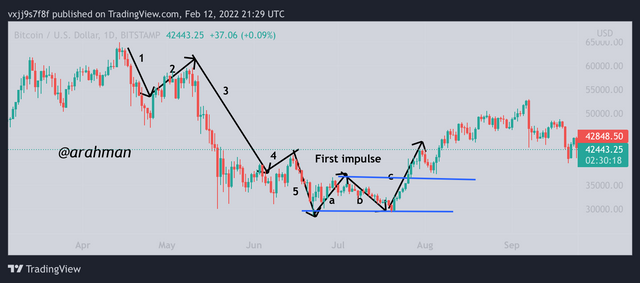
Illustration of first impulse
The last wave is usually formed after the first impulse wave and as it is mention in the rules, the three(3) corrective waves in the wave 5 is firstly identified. There is new trend formations that can be observed after the last corrective wave. This opens a way for traders to make profits from the trade. The chart below shows the las impulse wave;
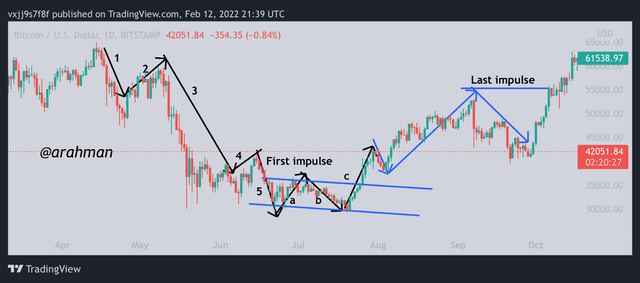
Illustration of last impulse

Question 6 : Show how to identify a good point to set a buy and sell order. (Use cryptocurrency chart screenshots)
The best way for a trader to be successful in trades in the market is to learn how to establish good market entry and exit positions. Meaning the traders should learn how to spot the buy and sell order signals in combination with other indication in order to succeed in trades. The following approaches can be follow using the Elliot wave theory to perform successful trades.
To execute a buy order, the trader must firstly be able to draw the wave 5 and impulse waves, then the corrective waves namely a, b and c are also drawn next. With the wave b and c, the trader should make sure a higher-high is formed . Now, the trader should look out to observe if the wave c is longer than that of wave a. When this happens it means that the first impulse has been formed and hence signals for a buy signal. The trader is now expected to execute a buy order, also it is recommended to set up stop loss and take profits in order to minimize losses and increases profits from the trade.
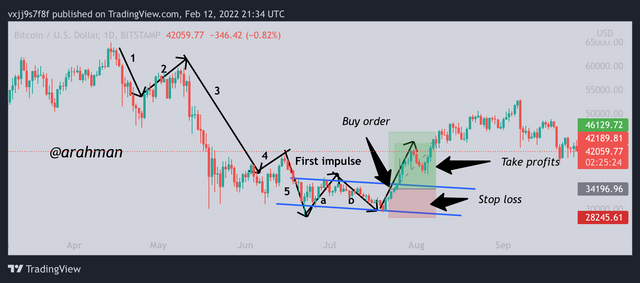
Illustration of Buy order
Also, the same principle is applied to place a sell order but in this case, the trader is supposed to look out for the last impulse formation on the chart. The last impulse is a signal of a downtrend approach and hence also signals for a sell order. The trader is then expected to place sell orders and set up a stop loss and take profits.
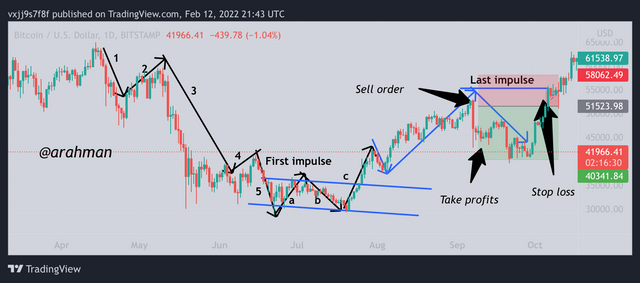
Illustration of sell order

Question 7: Explain the relationship of Elliott Wave Theory with the explained method. Be graphic when explaining.
The Elliot wave theory was developed by an individual called Mr. Ralph Nelson Elliot and his main concept about this theory was to identify reoccurring trends/patterns on a chart with the help of 5 waves. And his theory comes with a set of rules that have been described previously. It helps to attain a proper analysis in trades that comes out with something like the impulse wave and the last impulse. All these come together to help traders make proper market entry and exits.
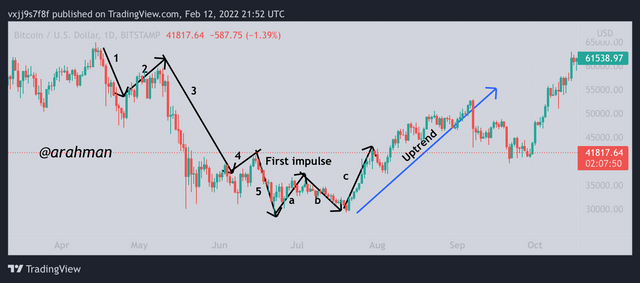
Illustration of Elliot wave theory
The formation of the first 5 waves are then followed by the three correction waves namely; a,b and c waves. These are the main and most important waves that helps traders to identify either the first or the last impulse wave. As a result of this, the trader is now able to place a buy order or a sell order and make profits from the trade.
It should be noted that the first impulse signals an uptrend while the last impulse signals a downtrend.

Conclusion
Trading is a daily activity that many individuals go through everyday. And the outcome is usually dependent on the price changes of assets on the market. In the crypto world, the price of assets are highly volatility and hence it is necessary to perform analysis on these assets perform starting up a trade. This helps investors to increase their profits and cut down losses.
Now the Elliot wave theory is widely used by many investors over the world to spot market trends of many assets and hence make good market decisions. This helps traders to establish good market entry and exit point to help increase their success in trading.
Thank you professor @nane15 for this informative lesson you have delivered. I wish to learn more from you in the coming weeks.


All screenshots are taken from the TradingView website.