CRYPTO TRADING STRATEGY WITH MEDIAN INDICATOR - Steemit Crypto Academy- Homework Post for Professor @abdu.navi03
Hello everyone, welcome to another week of the crypto academy, and this week’s lesson talks about Crypto Trading Strategy with Median Indicator. After studying the lesson material which was provided by professor @abdu.navi03 I have decided to write my submission post for the assignment tasks given.
 Canva
CanvaQuestion 1: Explain your understanding with the median indicator.
During our several periods in the crypto academy we have learned how to used different types of technical indicators and strategies to help improve our trading activities. Some of these indicators and strategies helps us to spot market trends and current state/conditions of an asset in the market.
The use of these indicators purposely helps traders to identify buy and sell signals which as a result helps us to take advantage of the trend in the market. These indicators are either trend based, that is it helps to identify a trend in the market or volatility based.
The Median Indicator is generally a technical indicator which takes much consideration into the price movement or the market trend of which an asset is currently moving in, in short it is a trend base technical indicator. With the help of this indicator, traders will be able to spot the current market trend of an asset and use it to their advantage. Even though the median indicator is a trend base indicator, it also measures the volatility of asset in the market.
The Median indicator comprises of parallel bands which comes from the Average True Range (ATR) which also uses the median value of the ATR range within a selected timeframe/interval. The whole concept of the indicator is that, it attains the median value from the two high peaks and lows and then compares it to that of the EMA within that periods. The difference of the Median indicator And EMA shows on the chart the current market trend by showing either green or purple cloud.
When the color is green, it signifies an uptrend and hence traders are urged to set their buy orders to take advantage of the potential uptrend. Also, when the color changes to purple, it signifies for a downtrend and hence traders are required to place their sell orders and exit the trade.
Basically, what actually occurs or accounts for the green and purple clouds is that, when the EMA value is higher than the median value, the clouds shows a purple color which indicates a downtrend. And when the EMA value is lower than the median value, then it shows a green color which signifies an uptrend.

Question 2: Parameters and Calculations of Median indicator. (Screenshot required)
For the purpose of this demonstration, I will be using a crypto chart from the TradingView website.
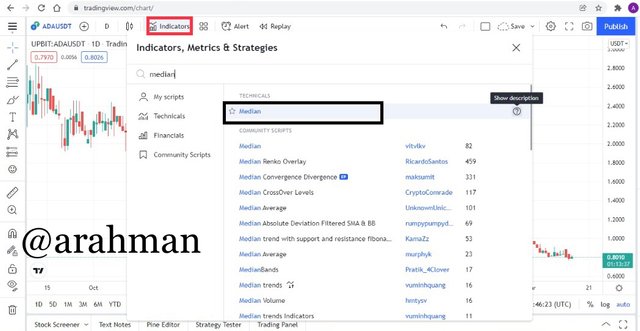
First of all, launch a chart from the website. For this demonstration, I have chosen the ADA/USDT pair.
Click on indicators with the symbol fx. Search and click on the Median indicator to add it to the chart.
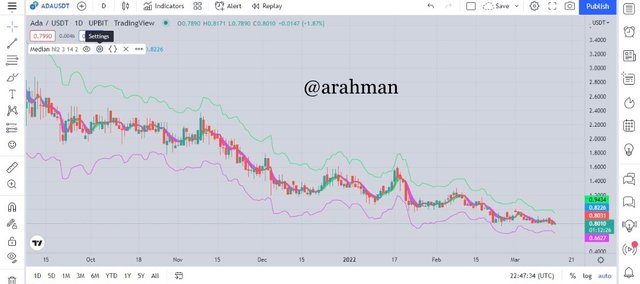
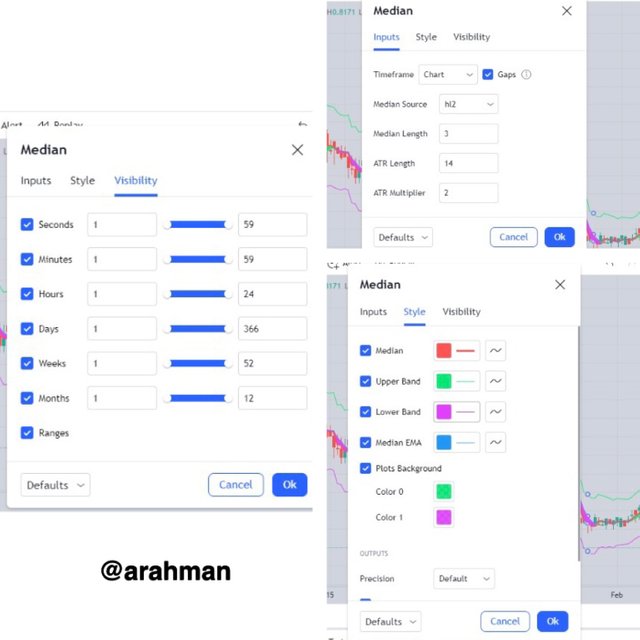
- Now look to the left side of the chart and click on the settings icon of the median indicator. Another menu will pop up. You can configure the indicator to suit your preference by changing the length, color and opacity of the lines and clouds.

The calculations of the median indicator is based on firstly finding the median value and EMA value.
Median value = highest price + lowest price / 2
EMA Value = Closing price x multiplier + EMA (previous day) x (1-multiplier)
Hence;
Median indicator = ATR %change (median value, EMA value)
Upper band = median length + ( 2ATR )
Lower band = median length - ( 2ATR )
Median length = n, period of observation.
Note:
If Median %change >= EMA value, results in green clouds
If EMA %change >= Median value, results in purple clouds
From the above calculations and expressions, we are able to understand the whole concept behind the median indicator. It naturally spots the differences between the EMA and median values to plot either a purple or green clouds in the chart. When the median value is greater than the EMA value, then we see a formation of green clouds which signals for an uptrend but when the EMA value is greater than or equal to the median value, it plots purple clouds on the chart which signals for a downtrend.
Question 3: Uptrend from Median indicator (screenshot required)
Just as I mentioned earlier, the median indicator is purposely designed to help traders identify potential market trends which will help trading more successful. The median indicator general finds the difference between the EMA value and median value in price movement to plot green and purple clouds which signals for uptre and downtrend.
In my previous explanation, I mentioned that when the median value is greater than the EMA value, then it shows a green coloration in the chart which also signals for an uptrend. So basically, the appearance of the green clouds is a signal for uptrend, hence traders are expected to place buy orders in the market.
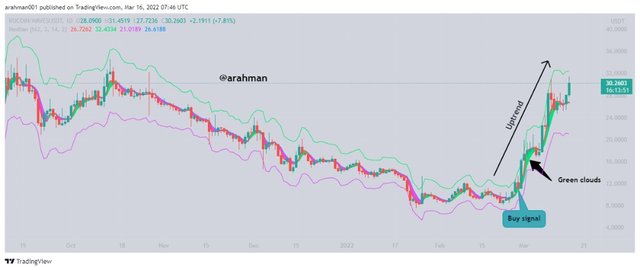
From the chart above, we can see the formation of a green clouds at the end of bearish period. This signifies a trend reversal into a bullish trend, meaning there is a signal for buy trades to be placed. Traders can take advantage of this bullish trend and make profits from buy trades.
Question 4: Downtrend from Median Indicator (screenshot required)
As I mentioned earlier, the median indicator is purposely designed to help traders identify potential market trends which will help trading more successful. The median indicator general finds the difference between the EMA value and median value in price movement to plot green and purple clouds which signals for uptre and downtrend.
In my previous explanation, I mentioned that when the EMA value is greater than the median value, then it shows a purple coloration in the chart which also signals for a downtrend. So basically, the appearance of the purple clouds is a signal for downtrend, hence traders are expected to place sell orders in the market.
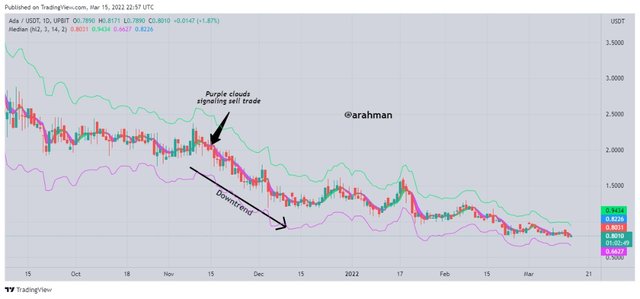
From the chart above, we can see the formation of a purple clouds at the end of bullish period. This signifies a trend reversal into a bearish trend, meaning there is a signal for sell trades to be placed. Traders can take advantage of this bearish trend and make profits buy placing sell trades to exit the market.
Question 5: Identifying fake Signals with Median indicator(screenshot required)
In our previous lessons, we have learned that it is very necessary to identify false and wrong signals in order to improve our trading success. This is why it is always advisable to combine using two indicators at a time in order to produce more accurate and reliable technical analysis.
As a result, I will combine the RSI with the Median Indicator to identify fake signals and strengthen my buy and sell signals. The RSI indicator also helps to identify the market conditions of an asset by showing the overbought and oversold regions. When the RSI value falls below the 30 marks, it shows that the market is in an oversold region, meaning the sellers are taking over the market and bullish reversal is expected. But when the RSI value falls above 70, the market is in an overbought region which means, buyers have taken over the market and bearish reversal is expected. We can use this idea to validate the signals obtained from the median indicator.
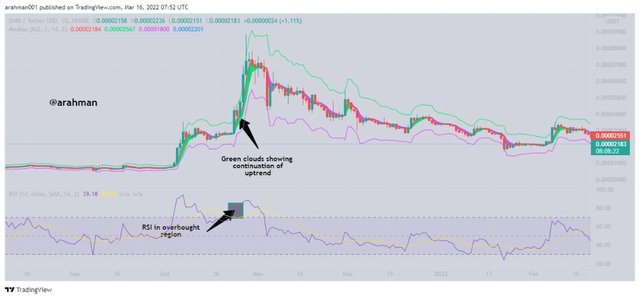
From the chart above, we can observe that the RSI is in an overbought region which signals of a bearish reversal in the price movement. But when you take a look at the median indicator, the clouds formed are continuing to be green which means that the buyers are still in control of the market and hence results in the continued uptrend. This is a clear scenario of how we can remove false signals from the use of the median indicator. With this, traders are now able to make the right market decisions in order to gain profits and be successful in their trades.
Question 6: Open two demo trades, long and short, with the help of a median indicator or combination that includes a median indicator (screenshot required)
Short Trade (Sell trade)
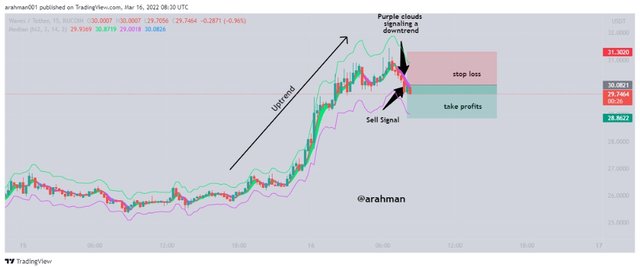
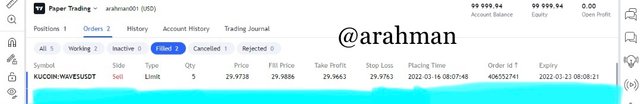
From the chart above, I have chosen WAVES/USDT pair for this demonstration at a timeframe of 15 minutes. I have clearly indicated my trade exit point where there is formation of purple clouds which is a signal for a potential downtrend in the price movement. We can observe that the median indicator crosses above the price movement which confirms the sell signal. So I decided to set my stop loss and take profits and execute the trade.
The prove of the sell trade executed is displayed below;

Long Trade (Buy trade)
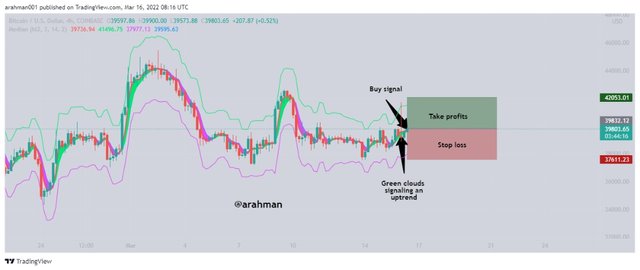
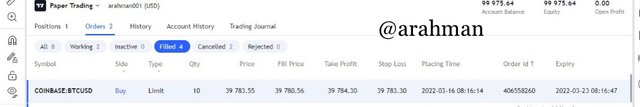
From the chart above, I have chosen BTC/USDT pair for this demonstration at a timeframe of 4 hours . I have clearly indicated my trade entry point where there is formation of green clouds which is a signal for a potential uptrend in the price movement. We can observe that the median indicator forms below the price movement which confirms that an uptrend is approaching and hence a buy signal. So I decided to set my stop loss and take profits and execute the buy trade.
Prove of the transaction is displayed below;
Conclusion
The median indicator simply scans for the difference between the Median value and the EMA value which then plots a green or purple clouds in the chart to signify a downtrend or uptrend. The formation of green clouds below the price movement is a signal for uptrend and calls for a buy signal. Also, the formation of purple clouds signals for a downtrend and signals for sell signals.
Also we should keep in mind that the median indicator can sometimes give out false and wrong signals. This is why it is advisable to come it with other technical indicators in order to give out reliable signals. In short, the median indicator is a trend based indicator which is very simple to used and can also help traders identify market trends to boost their trading capabilities.
Thank you professor @abdu.navi03 for this great lesson you have given us this week. I hope I can learn more from you in the coming weeks.

Note: All screenshots are taken from the TradingView website