Psychology of Trends Cycle - Crypto Academy / S6W4- Homework Post for professor @reminiscence01
Greetings to everyone, it is another week of the crypto academy and I’m here once again to present my solutions to the assignment tasks. This week's lesson was about the topic Psychology of Trends Cycle and it was delivered perfectly by our professor @reminiscence01.
 Edited with Canva
Question 1: Explain your Understanding of the Dow Jones Theory. Do you think Dow Jones Theory is Important in technical analysis?
Dow Jones theory is a concept which was developed by an individual who goes by the name Charles H. Dow in the year 1897. This theory simply talks about how the various market actions affect the price movement of an asset or commodity in the market. What this means is that, the volume, distribution, accumulation, distribution, and news impact all have an affect on the market behavior of the asset. As a result, price movement can either move in an uptrend or downtrend but sometimes in a sideways movement.
From the Dow Jones theory, it states that the price movement of an asset usually moves either in an uptrend or a downtrend and may also move in a sideways direction (Thus the market may not be trending). Also the theory also explains how the price movement occurs during a trending phase, it can move sharply in a high level, medium level or sometimes the price movement occurs slowly( in a small amount/level). This results in the three phases of which price movement occurs with the explanation of Dow Jones theory. Price movement can move for longer periods, medium long periods and shorter period.
Additionally, the theory also explains that certain market trends and information all accounts to price reactions in the market. This means that, the previous higher-highs and lower-lows points are affect the price movement of the asset or commodity. With this, information such as volume of the asset in the market also affects the price reaction which shows the true structure/condition of the market.
Lastly, the theory helps to explain how the market trend continuation and reversal all occur. This section of the theory talks about how the market can move in one particular direction or change to the opposite direction. In short, an uptrend continuation will occur when there is formation of newer higher-highs while a downtrend continuation will occur when there’s formation newer lower-lows.
From my explanations above, I believe the Dow Jones theory is very important in technical analysis. This is because, it helps us to understand market structure and price movement of an asset. With this, we are also able to understand the trending nature and periods of the asset. All this comes together to help traders find the advantages points of which we can make profits from trades.

Question 2: In your own words, explain the psychology behind the Accumulation and Distribution phases of the market. (Screenshots required)
In the price movement of an asset, several factors affect the behavior of the asset and this is where the accumulation and distribution phases come in. Each of these phases is responsible for uptrend, downtrend and sideways movement of prices in the market. In this chapter, I will be explaining what happens in these two phases.
Accumulation Phase
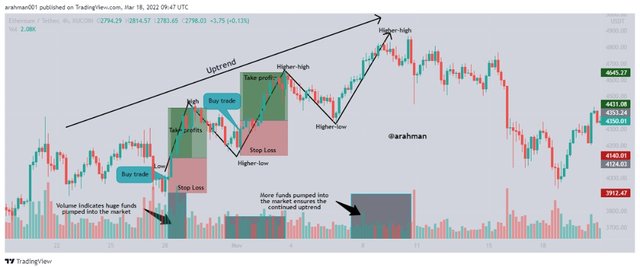
As I mentioned earlier, the accumulation phase in the market is the state where normally an uptrend occurs in the price movement of an asset. All that happens in this phase is mainly dependent on the activities of whales in the market. In the accumulation phase, the price of the asset is at a low price and then whales come in with huge purchases of the asset. As a result, more funds are pumped into the market which causes a significant gradual rise in the price of the asset. The whales continue to pump funds into the market until a set high value of the asset is archived. When this happens, traders can clearly see an uptrend in the market. A further explanation is done with the chart below.
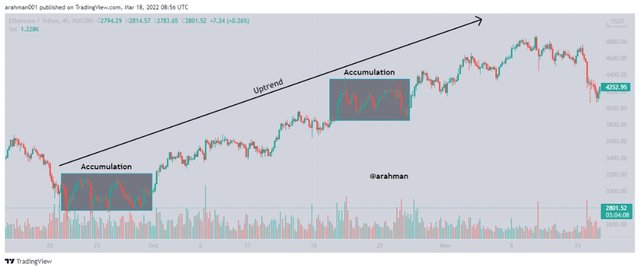
From the chart above, I have clearly indicated the accumulation phases where the price of the asset is significantly low. This period creates a chance for investors to jump into the market and make purchases of the asset. During this stage the price of the asset begins to move upwards. From the chart, we can observe that the price of the asset continues to go up and this is from the high funds being pumped into the market. Over sometime, investors take out their profits while the bullish trends comes to a stop. Then the accumulation process starts again, and with this we can see another continuation of the uptrend in the chart.
Distribution Phase
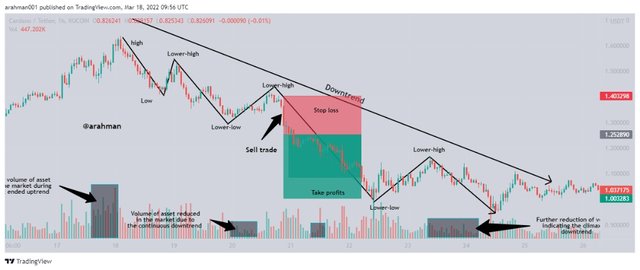
This phase is exactly the opposite of the accumulation phase. As I mentioned earlier, the distribution phase in the market is the state where normally a downtrend occurs in the price movement of an asset. All that happens in this phase is mainly dependent on the activities of whales in the market. In the distribution phase, the price of the asset is at a high price and then whales come in with huge sales of the asset. As a result, more funds are removed from the market which causes a significant gradual decline in the price of the asset. The whales continue to remove funds from the market until a set low value of the asset is archived. When this happens, traders can clearly see a downtrend in the market. A further explanation is done with the chart below.
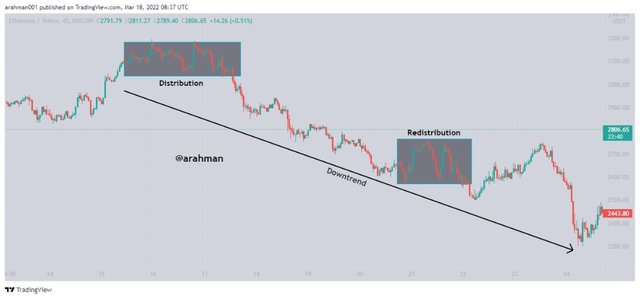
From the chart above, I have clearly indicated the distribution phases where the price of the asset is significantly high. This period creates a chance for investors to jump out the market and make sales of the asset. During this stage the price of the asset begins to move downwards. From the chart, we can observe that the price of the asset continues to go down and this is from the high funds being pumped out of the market. Over sometime, investors take out their profits while the bearish trends comes to a stop. Then the distribution process starts again, and with this we can see another continuation of the downtrend in the chart.
Question 3: Explain the 3 phases of the market and how they can be identified on the chart.
The price movement of an asset in the market accounts for the market structure and in this case a market can be in a trending condition or at rest which is the sideways movement. The three phases in market are identified as bullish/uptrend, bearish/downtrend and the ranging/sideways. These phases may sometimes occur in a chart at once and it is very advisable to learn how to spot the three phases.
Uptrend
In this phase, we can clearly observe a continuous price increase of the asset which is caused by the constant demand in supply of the asset. During this phase, it should be noted that there is usually an accumulation phase that occurs first and this causes a spike in price movement. As a result, new higher highs are formed gradually when the price continues to move up and the previous lower-lows also move up. A repeated sequence of new higher-highs and lows formed on the chart produces an uptrend structure which clearly indicates an increase in price movement of the asset.
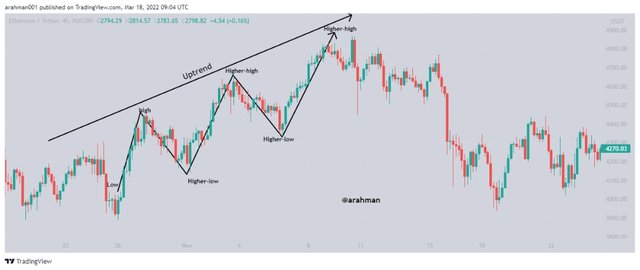
The chart above clearly explains in summary what occurs during the uptrend phase.
Downtrend phase
In this phase, we can clearly observe a continuous price decline of the asset which is caused by the low demand in supply of the asset. During this phase, it should be noted that there is usually a distribution phase that occurs first where traders take out their funds by performing hard sales on the asset. As a result, new lower-lows are formed gradually when the price continues to move down and the previous lower-lows also move downward. A repeated sequence of new low-lows and lower-highs formed on the chart produces a downtrend structure which clearly indicates a decline in price movement of the asset.
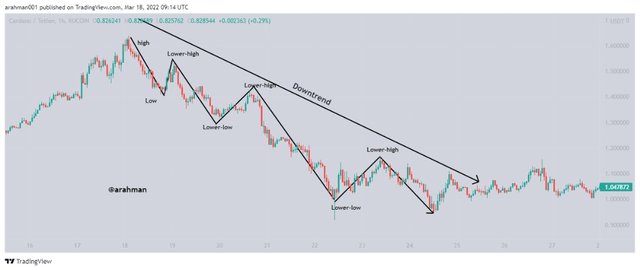
The chart above clearly explains in summary what occurs during the downtrend phase.
Sideways Phase
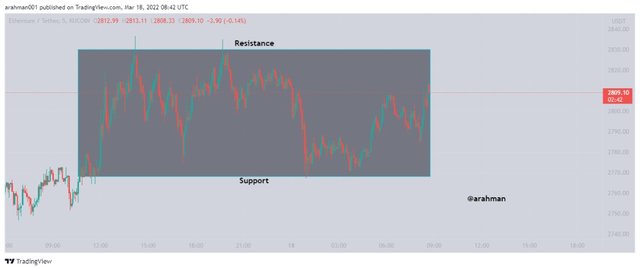
This phase in the market is actually a balance of both uptrend and downtrend. In this phase, there is a battle between buyers and sellers which causes a balance between supply and demand of the asset. As a result, there is a steady flow of price movement of the asset and the price usually maintains an almost constant value. Also in this phase we can see accumulation and distribution occurring whereby we see a smooth price movement between the support and resistance levels. The sideways phase also sometimes signifies the end of a trending market.
Below shows a clear example of how sideways phase occurs in the market:
Question 4: Explain the importance of the Volume indicator. How does volume confirm a trend? Do this for the 3 phases of the market (Screenshots required).
The volume indicator is a tool that helps traders understand the concept behind supply and demand of an asset in the market. It helps traders to identify the periods or phase where the market is more volatile. We can obtain information such as high cash in flow and outflow from using the volume indicator.
Additionally, the volume indicator together with other indicators can help traders to spot and identify fake signals and trends in the market. Volume indicator general helps traders to determine whether the market is trending or not. When the asset is in either distribution or accumulation phase, we can see low volume of the asset in the market. This is a clear scenario of how the volume indicator is used to identify trends.
Confirmation of uptrend with volume
As I mentioned earlier, during an uptrend we can observe formation of newer higher-highs and lower-highs in the chart which occur sequentially in the chart. Also there’s more demand of the asset than supply in the market. This causes a clear uptrend structure in the chart analysis. From the volume indicator, we can notice a spike of candles which confirms the uptrend structure/movement.
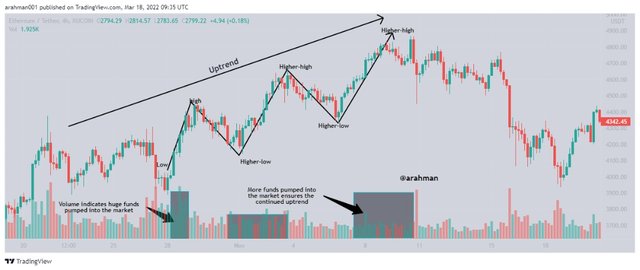
From the chart above, we can clearly see the market structure is currently an uptrend. And when you take a look at the volume indicator, we can sharp rises and volumes which further confirms the uptrend movement. This is as a result of huge funds being pumped into the market.
Confirmation of downtrend with volume
As I mentioned earlier, during an downtrend we can observe formation of newer lower-lows and lower-highs in the chart which occur sequentially in the chart. Also there’s more supply of the asset than the demand in the market. This causes a clear a downtrend structure in the chart analysis. From the volume indicator, we can notice a short candles which confirms the downtrend structure/movement.
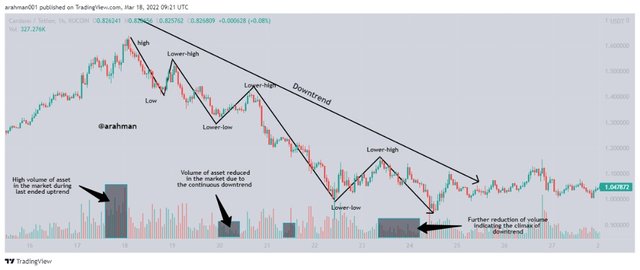
From the chart above, we can clearly see the market structure is currently a downtrend. And when you take a look at the volume indicator, we can small rises and volumes which further confirms the downtrend movement. This is as a result of huge funds being pumped out of the market.
Confirmation of sideways with volume
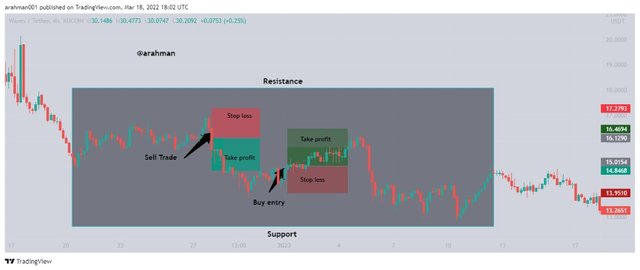
In this phase, we see in the chart that there is a balance of both supply and demand of the asset. As a result, price movement occurs steadily between support and resistance over a short period until there is a trend breakout. This phase can either be distribution of accumulate and in this phase, the volume indicator shows just little amounts of candle. In the sideways movement we can say that the market is less volatile.
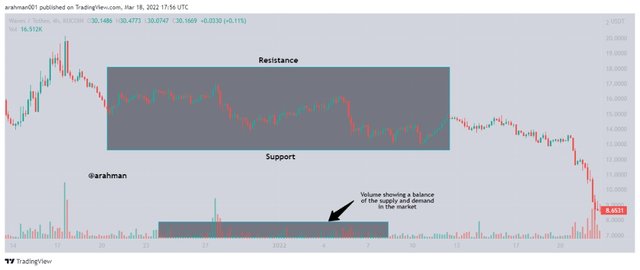
In the chart above, we can see that the market is ranging between the support and resistance and this creates a balanced between supply and demand. As a result, the volume indicator is nearly invisible and this interprets into chart not showing any clear market trend.
Question 5: Explain the trade criteria for the three phases of the market. (show screenshots)
Trade Criteria For an Uptrend Phase
There should be a clear uptrend structure formation on the chart, with new higher-highs and higher-lows formed in sequence. Additionally a conclusion of the uptrend can be drawn from the volume indicator showing high volume of funds pumped into the market.
Traders should look out for price retracement after a pull back occurs and then an impulse reaction which starts from the previous high points. The new low should start from the previous high and hence a continuation of the uptrend. A buy order can now be executed after the presence of a bullish candlesticks appearing on the chart.
A stop loss should be set slightly below the support line which is the new higher-low and take profits should be set above the previous higher-highs. Note, the risk management ratios should reasonably applied to avoid losses, I suggest a ratio of not more than 1:2.
Trade Criteria For an downtrend Phase
There should be a clear downtrend structure formation on the chart, with new lower-lows and lower-highs formed in sequence. Additionally a conclusion of the downtrend can be drawn from the volume indicator showing high volume of funds pumped out of the market.
Traders should look out for price retracement after a pull back occurs and then an impulse reaction which starts from the previous low points/support level. The new high should start from the previous low and hence a continuation of the downtrend where there is a new support formed. A sell order can now be executed after the presence of a bearish candlesticks appearing on the chart.
A stop loss should be set slightly above the resistance line which is the previous lower-high and take profits should be set significantly below the previous lower-lows or support . Note, the risk management ratios should reasonably applied to avoid losses, I suggest a ratio of not more than 1:2.
Trade Criteria For a Sideways Phase
In this phase, the trade outcomes may be very risky since the trend breakout can occur in any direction at any point.
Execute a buy trade when the price movement hits and bounces of the support line. On the other hand, execute a sell trade when the price movement hits and bounces of the resistance line.
For a buy trade, set your stop loss below the support line and take profits within a range or above the resistance line. But for a sell trade, set your stop loss above the resistance line and take profits near the support line.
Question 6: With the Trade criteria discussed in the previous question, open a demo trade for both Buy/ Sell positions.
Buy Trade
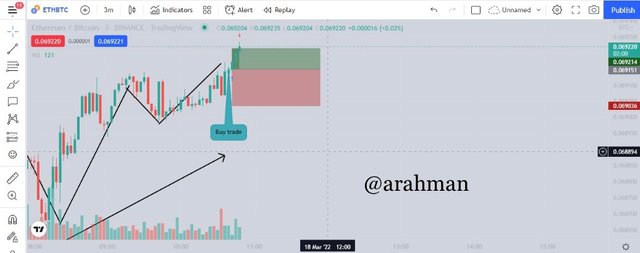
In chart above of ETH/BTC with a selected timeframe of 3 mins, I have clearly identified that the market is in an uptrend phase. And this can be confirmed from the formation of new higher highs and higher lows. Also it can be observed that there is a retracement trend which creates a new low point and the impulse reaction from the market which affects the price movement to continue the uptrend. The uptrend is further confirmed with the volume indicator where there is evidence of huge funds pumped into the market.
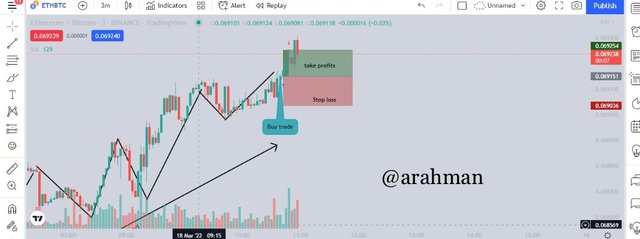
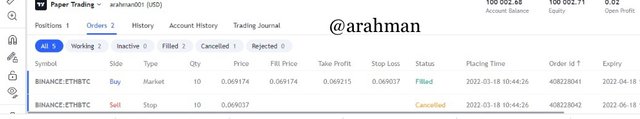
From observations and findings, I decided to execute a buy trade after the appearance of the first bullish reversal candlestick. Then I decided to set up stop loss and take profits at $0.56 and $0.78 respectively which gives me a suitable risk-reward ratio. From the chart above we can see that the price breaks the take profits zone, and hence the buy order is executed while the sell order canceled. Below is a probe of the trade:

Sell Trade
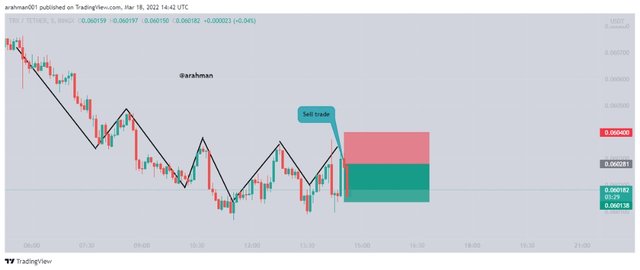
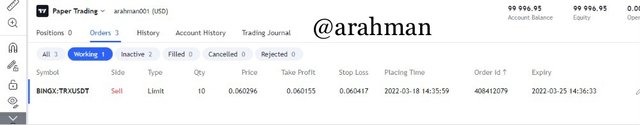
In chart above of TRX/USDT with a selected timeframe of 5 mins, I have clearly identified that the market is in a downtrend phase. And this can be confirmed from the formation of new lower-lows and lower-highs. Also it can be observed that there is a retracement trend which creates a new high point and the impulse reaction from the market which affects the price movement to continue the downtrend.
From my observations and findings, I decided to execute a sell trade after the appearance of the first bearish reversal candlestick. Then I decided to set up stop loss and take profits at $0.060400 and $0.060138 respectively which gives me a risk-reward ratio of 1:2.
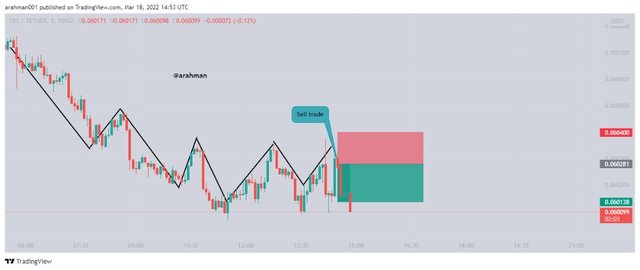
The image above shows how the price movement breaks the take profits region. Here the sell trade is successfully executed and we can see the prove of transactions below:

Conclusion
The Dow theory takes into consideration several factors such as distribution and accumulation which helps us to analyze and observe trends in the price movement of an asset. From the theory, we have learned that when there is high capital pumped into the market, we are likely to see an uptrend structure in the chart analysis. With this, we can conclude that the volume of the asset in the market greatly has an impact in which direction the price movement occurs.
Also, in my explanation of the theory I have stated the three phases whereby price movement causes with regards to the volume in the market and the supply and demand of that asset. Usually, when there is more demand of the asset than supply in the market, we experience an uptrend. The opposite of this shows a downtrend structure in the market. Lastly, when there is a balance or say an equilibrium of the supply and demand, the market/price movement tends to move in a sideways direction. At this point we can say that the market is at rest and this causes a steady price movement range.
Thank you professor @reminiscence01 for this very informative lecture. I have really involved myself and learned a lot from this lesson and hope I can learn more from you in the next lessons to come.

All screenshots are taken from TradingView
Hello @arahman , I’m glad you participated in the 4th week Season 6 at the Steemit Crypto Academy. Your grades in this Homework task are as follows:
Observations:
This trade setup is not correct for a bullish criteria explained in the lesson.
Recommendation / Feedback:
Thank you for participating in this homework task.