Support and Resistance Breakouts - Crypto Academy / S6W3 - Homework post for pelon53
 Canva
CanvaHello everyone, welcome to another week of the crypto academy. This week’s lesson which was delivered by prof @pelon53 talked about Support and Resistance Breakouts. This post is my entry to the assignment tasks given.
Question 1: Explain in detail the advantages of locating support and resistance on a chart before trading.
Over the previous crypto academy lessons we have always learned that it is very important to establish good market signals in order to capitalize and gain more profits from trades. The identification of Support and Resistance plays another advantage to traders in the market. This helps them make correct market decisions.
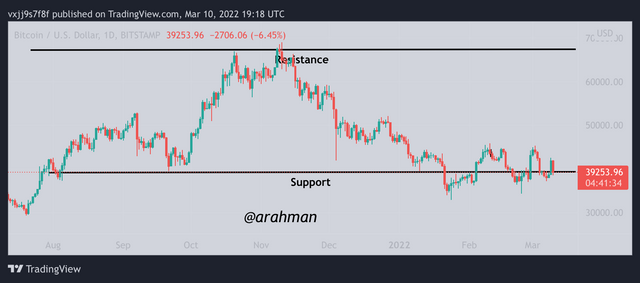
Basically, support and resistance are regions on the price chart that appear due to a subsequent trend in price action of a chart. The support level is the one which is located at the bottom of the chart and it is formed when the market trend continuously moves in a downtrend. The Resistance on the other hand is found at the top of the chart and when the market moves in an uptrend.
Identification of the support and resistance helps traders determine the current market state of the asset. Meaning, when the support is identified, traders assume that the market has been in a decline which basically means a downtrend. Also when the resistance is determined in the chart, is shows the traders that the current state of the market is uptrend. Downtrend further explains that there are more sellers in the market than buyers while the uptrend indicates that more buyers are in the market than sellers.
Also, the identification of support and resistance helps traders to spot and predict potential trend breakouts and resistance in the chart. When the support and resistance levels are established, the traders can predict whether the next trend breakout will be an uptrend or downtrend. When there is a support level identified, the possible trend breakout is uptrend and when the resistance level is identified, the possible trend breakout is downtrend.
Additionally, the identification of support and resistance helps trades establish good market entry and exit positions. When there is potential trend breakout spotted it helps traders to make a correct market decisions. Since identification of a support level predicts an uptrend, traders will be able to set up market entry positions and make good use of the upcoming bull period. Also the resistance level signals for a downtrend and hence traders prepare to exit the market. In short, identification of support and resistance provides good market entry and exit signals.

Question 2: Explain in your own words the breakout of support and resistance, show screenshots for the breakout of a resistance, use another indicator as a filter.
Breakouts are generally a signal for market entry and exit positions to be established and it can happen in either the support and resistance levels. Traders then use these trend breakout as an opportunity to make profits from the market. Even though sometimes the breakout can give a false signal, it is always advisable to filter it with the uses of other technical indicators.
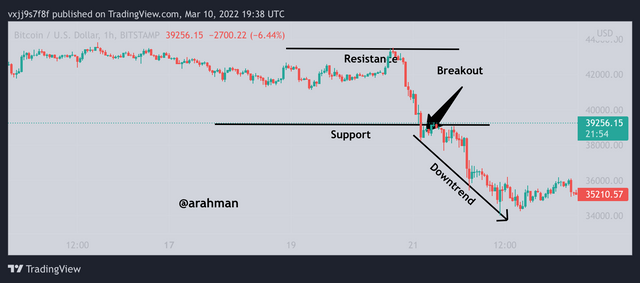
The breakout at the Support level occurs when there is higher volumes of the asset pumped out the market which causes a further decline in the price of the asset. This means that, the price movement moves below the initial support level. When this happens, it calls for traders to exit the trade by placing their sell others.
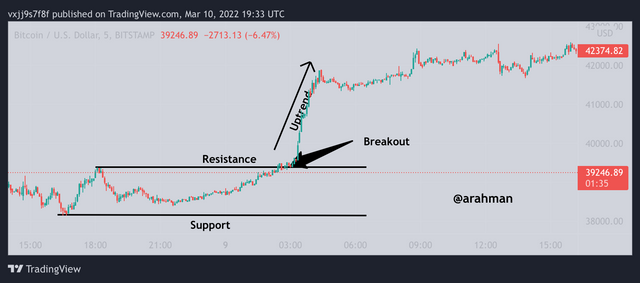
Breakout of resistance on the other hand occurs when there’s is more value of the asset pumped into the market causing the initial high level to break more upwards. This action calls for an entry into the market, hence traders place their buy orders.
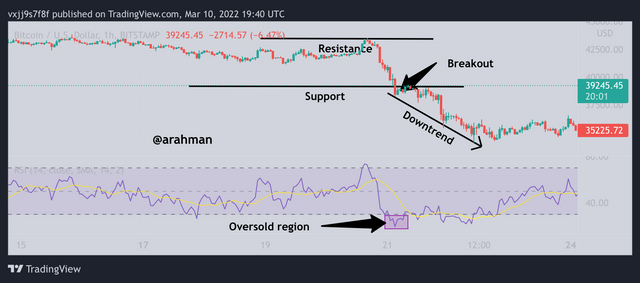
In some cases, the support and resistance breakout may provide wrong or false signals. This is why it is advisable to filter out these false signals with the use of other indicators. Mostly I filter out false signals by using the RSI indicator. Below shows a chart of BTC/USDT. Using RSI to filter false signals from support and resistance breakout.

From the chart above, we can clearly identify the support and resistance levels. The breakout of the support level can be confirmed by comparing with the RSI indicator. When the RSI is in an oversold region, it confirms the support breakout. Also, when the RSI is the overbought region, it also confirms the Resistance breakout.
Question3: Show and explain support breakout, use additional indicator as filter, show screenshots.
Just as I mentioned earlier, the support breakout occurs when the price movement moves below the previous lowest in the chart. And this is caused by huge amounts of the assets being pumped out of the market. In this case, it shows that there are more sellers on the asset in the market than buyers.
As a result of this, a further decline in the chart is observed which also shows a downtrend. This action creates a window for traders to exit the trade and set up stop losses. However, this information of the support breakout may not 100% true and investors may run into losses by the false signals provided.
This is why it is necessary to adapt another usage of a different indicator. The confirmation from the other indicators will help traders to make the right exit positions. In filtering out these wrong and false signals, I will again use the RSI indicator.
For this demonstration, I will use the BTC/USD chart with the application of RSI indicator.
From the chart above, we can observe from the RSI indicator that the market is currently in an oversold region and this is a signal for support breakout in the chart. The information from the RSI Indicator which is compared to that of the support breakout in the chart is a clear indication that there is a true and correct signal produced from the support breakout.
Question 4: Explain what a false breakout is and how to avoid trading at that time. Show screenshots
In the crypto market, identifying proper market entry and exit all falls on the potential market trend formation. The trend breakout from these support and resistance breakout creates a chance for traders to take advantage of and make profits from their trades.
However, a false breakout may occur in the price movement of the asset and this sometimes hurts some traders who do not have much experience of the crypto market. In some cases, these false breakouts are influenced by whales who manipulate the market into their favor. This is why it is so important to look out for false breakouts in the market.
A false breakout occurs when there is a break on either the support or resistance level and continue the trend for a short period and later moves back to a different direction. For instance, in a false support breakout, when traders expect a continuous downtrend, the price movement shifts to an uptrend. Similarly, for a false resistance breakout, traders expect a continuation of uptrend but rather, the market trend shifts to a downtrend.
False breakouts happens most of the time and so it is advisable to be on the lookout and learn how to avoid falling for such cases. The most advised way to filter or identify these false breakouts is by using technical indicators. Example of some technical indicators that can be used to filter and avoid the false breakouts are MACD indicator and RSI indicators.
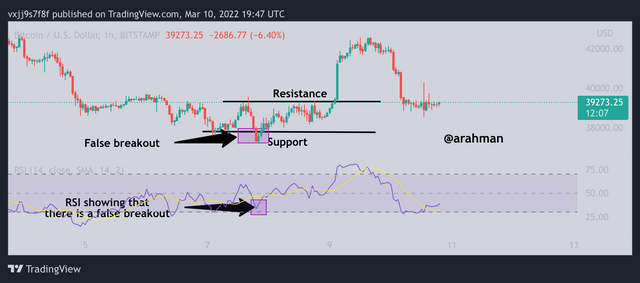
From the chart above, we can see a clear false support breakouts and this can be confirmed by comparing with the RSI indicator. In the chart we can notice that after the support is broken, it quickly pulls back into an uptrend. This clearly shows a false breakouts produced.
Question 5: On a demo account, execute a trade when there is a resistance breakout, do your analysis. Screenshots are required.
For this part of the assignment and demonstration, I have decided to use the TRX/USD chart pair. The time frame for this chart is set at 1 hour. Most of the times, I prefer short time periods since it’s a suitable trade set up to make more profits. Also, I have clearly identified my support and resistance levels in the chart.
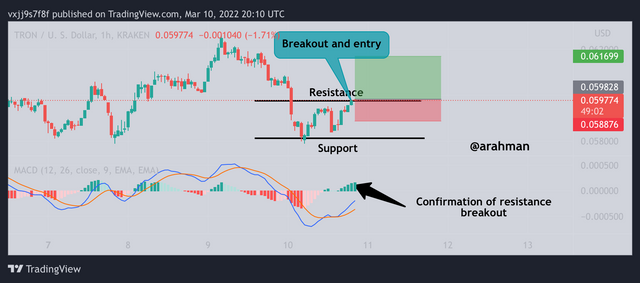
From the chart above, we can observe that there is a break in the resistance line. This calls for buy signals and time to place orders but I have to confirm this signal with another indicator. From the volume indicator, it also shows a clear uptrend so I decided to set a buy trade and also include take profits and stop loss.
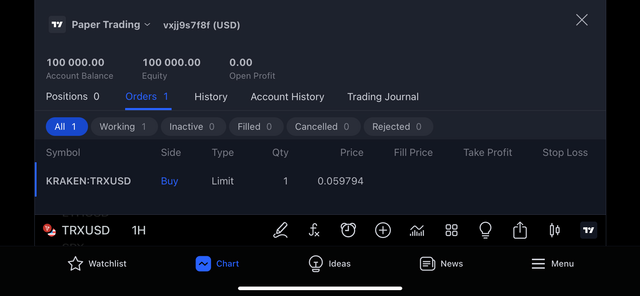
Transaction of Buy order
Question 6: In a demo account, execute a trade when there is a support break, do your analysis. Screenshots are required
For this part of the assignment and demonstration, I have decided to use the ADA/USD chart pair. The time frame for this chart is also set at 1 hour. Most of the times, I prefer short time periods since it’s a suitable trade set up to make more profits. Also, I have clearly identified my support and resistance levels in the chart.
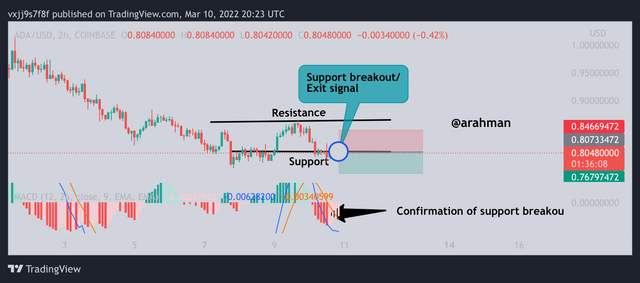
From the chart above, we can observe that there is a break in the support line. This calls for sell signals and time to place orders but I have to confirm this signal with another indicator. From the volume indicator, it also shows a clear downtrend approaching so I decided to set a sell trade and also include take profits and stop loss.
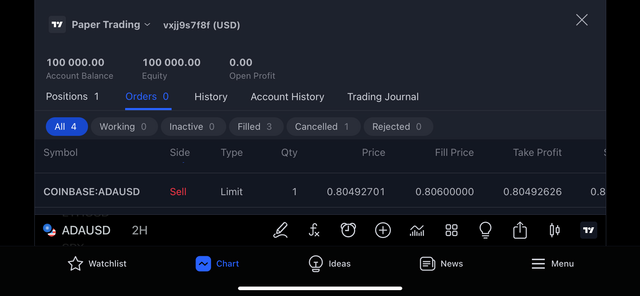
Transaction of sell order

Conclusion
It is always good to identify our support and resistance levels in every chart before we perform any technical analysis. The Support and resistance breakout helps traders to identify possible market entry and exit positions. Also it helps traders determine the current market structure of the asset.
One other important or support and resistance breakout is that, it helps traders to predict the market trend of an asset. These information gathered from the breakout just like other strategies can not be fully reliable and this is why it is advisable to filter false signals with the use of other indicators.
In general, it is good to try out other indicators in order to acquire good and reliable results from technical analysis. The support and resistance breakout is a very good strategy and if used wisely with other indicators, it may be of good use to investors.
Thank you again professor @pelon53 for this informative lesson. See you in the next lesson.

All screenshots are taken from TradingView