Trading Using Wedge Pattern - Crypto Academy / S5W5 - Homework Post for @sachin08
Greetings to everyone and welcome to another week of the crypto academy. In this week’s lesson, our professor @sachin08 discussed about Trading Using Wedge Pattern and this topic seems very interesting. So after reading the lesson notes and with some research applied, I have decided to complete the assignment tasks given.
 Canva
CanvaQuestion 1: Explain Wedge Pattern in your own word.
Over the previous weeks, we have learned about different trading patterns which help investors/traders to improve upon their trading capabilities in the market. These patterns helps many traders to accumulate more profits from their trades while their losses are minimized.
In this chapter, we are talking about the Wedge Pattern as another strategy/chart pattern that helps investors to identify market trends, trend reversals and trend continuation. Just like the other patterns, the wedge pattern helps us to predetermine the market price of an asset or direction of the market price in other to make good decisions when trading.
 BTC/USD chart fromTradingView
Wedge pattern is basically a shape formed on the price chart of an asset that shows 2 Trendlines , support and resistance that are inclined to each other to form the shape of a wedge. This wedge pattern is usually formed in the middle of a trending market and it may help to identify a continuation of the trend or reversal of the trend.
When the market is moving in a bullish trend, it reaches a point where the trend pauses signifying a small appearance of downtrend and calls for a trend continuation or reversal. This means that the angle between the two(2) trend lines of the wedge pattern decreases as the market trend reaches its end.
So basically, the wedge pattern can either be signaling for a trend continuation or a trend reversal. Also there are two (2) forms of the wedge pattern, namely ; Rising wedge and Falling wedge patterns

Question 2: Explain both types of Wedges and How to identify them in detail. (Screenshots required)
The Rising wedge is also considered as the bearish form of wedge pattern formation and this is because, at the end of each rising wedge downtrend is usually followed and hence giving another name to rising wedge as the bearish wedge.
The beginning of the rising wedge starts after a recently ended bearish period and the opening of the rising wedge is very wide. Meaning the rising wedge starts at a wides angle, indicating an uptrend while the prices continues to move in an uptrend it also narrowly reduces the width of the wedge. This as a results forms a convergent point at which the two lines of the pattern meet.
The convergence of the upper Trendline called resistance and the lower Trendline called support are usually connected by two or more highs and lows. The market usually bounces off and back between these two Trendlines in an upward direction. And at the end of the bullish period, there is usually a trend reversal into a bearish trend where the market price moves in a downtrend.
Also, in some cases the rising wedge pattern can be formed during a bearish period. The formation of a rising wedge during a bearish period usually signals for a trend continuation and the formation of a rising wedge in a bullish period signals for a trend reversal. This simply means that when the rising wedge is formed during a bearish period, the price movement will continue to move in a downtrend but when the rising wedge is formed during a bullish period, the price movement reverses to a downtrend.
 BTC/USD chart fromTradingView
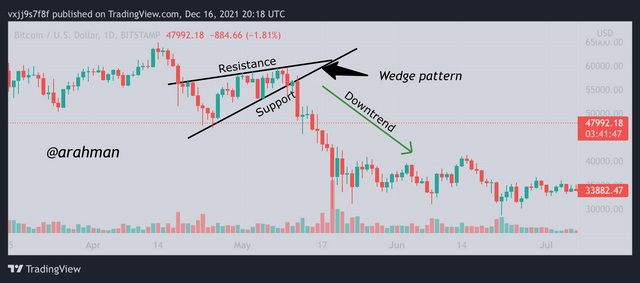
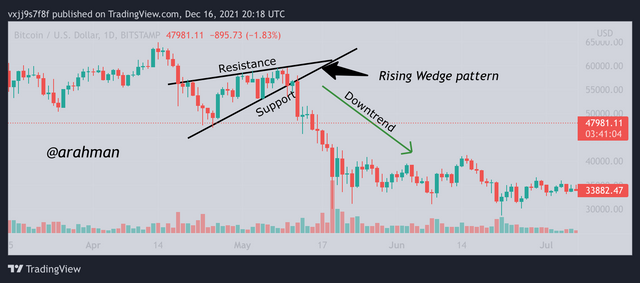
In the above image, it can be noticed that at the beginning of the wedge formation it is very wide in which the market moves in an uptrend. Over a period of time, the continuous movement of the price in a bullish trend goes narrowly where the two trend lines meet at a point of convergence.
The meeting point of the the support and resistance lines creates a breakout point where there maybe a trend reversal or trend continuation. In the above image, it shows that after the wedge pattern, the price movement shifts to a downtrend and this signals for a bearish period.
Identifying a Rising Wedge
Firstly, all you have to do is to identify the part/section of the chart where the price movement is slowly trending. With the rising wedge, the price movement may be in a bullish trend which leads to a narrow price movement.
Identify at least two points higher-highs and lower-lows for the resistance and support levels.
The next thing to do is draw the two (2) Trendlines, making sure they pass through the points identified to formed a slope where the resistance line and the support line meet at the apex of the bullish trend. From this, the rising wedge pattern will be clear shown in the chart.
Make sure that the price movement bounces off and back from the resistance line to that of the support line.
One other thing to take notice is that the breakout of trend usually occurs at the point where the two Trendlines meet. The breakout volume decreases, signaling a downtrend.

The Falling wedge is basically the opposite of rising wedge. It is also considered as the bullish form of wedge pattern formation and this is because, at the end of each falling wedge, an uptrend is usually followed and hence giving another name to rising wedge as the bullish wedge.
The falling wedge usually starts after a recently ended bullish period and the opening of the falling wedge is very wide. While the prices continues to move in an downtrend, it also narrowly reduces the width of the wedge. This as a results forms a convergent point at the bottom of the chart in which the two lines of the pattern meet.
The convergence of the upper Trendline called resistance and the lower Trendline called support are usually connected by two or more highs and lows. The market usually bounces off and back between these two Trendlines in a downward direction. And at the end of the bearish period, there is usually a trend reversal into a bullish trend where the market price moves in an uptrend.
Also, in some cases the falling wedge pattern can be formed during a bullish period. The formation of a falling wedge during a bullish period usually signals for a trend continuation and the formation of a falling wedge in a bearish period signals for a trend reversal. This simply means that when the falling wedge is formed during a bullish period, the price movement will continue to move in a downtrend but when the falling wedge is formed during a bearish period, the price movement reverses to an uptrend.
 BTC/USD chart fromTradingView
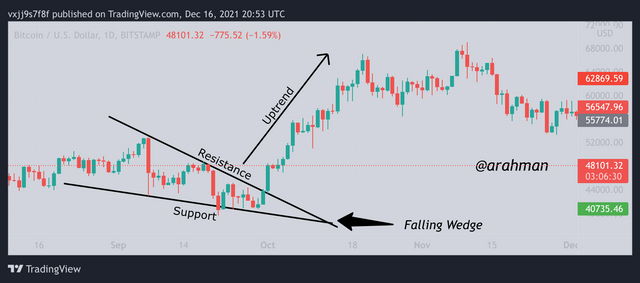
In the above image, it can be noticed that at the beginning of the falling wedge formation it is very wide in which the market moves in a downtrend. Over a period of time, the continuous movement of the price in a bullish trend goes narrowly where the two trend lines meet at the bottom, a point of convergence.
The meeting point of the the support and resistance lines creates a breakout point where there maybe a trend reversal or trend continuation. In the above image, it shows that after the wedge pattern, the price movement shifts to an uptrend and this signals for a bullish period.
Identifying a Falling Wedge
Firstly, all you have to do is to identify the part/section of the chart where the price movement is slowly trending. With the falling wedge, the price movement may be in a bearish trend which leads to a narrow price movement.
Identify at least two points higher-highs and lower-lows for the resistance and support levels.
The next thing to do is draw the two (2) Trendlines, making sure they pass through the points identified to formed a slope where the resistance line and the support line meet at the apex of the bearish trend. From this, the falling wedge pattern will be clearly shown in the chart.
Make sure that the price movement bounces off and back from the resistance line to that of the support line.
One other thing to take notice is that the breakout of trend usually occurs at the point where the two Trendlines meet. The breakout volume increases, signaling an uptrend .

Question 3: Do the breakout of these Wedge Patterns produce False Signals sometimes? If yes, then Explain how to filter out these False signals.
In my experience of using this Wedge pattern, I would say Yes it sometimes produces false signals. This is act of producing false signals is common to many indicators or strategies used in technical analysis. And as a result, no pattern, strategy or indicators is 100% reliable in performing analysis. That is why it is always advisable to combine the use of two or more strategies in order to produce a more accurate and reliable analysis.
 BTC/USD chart fromTradingView
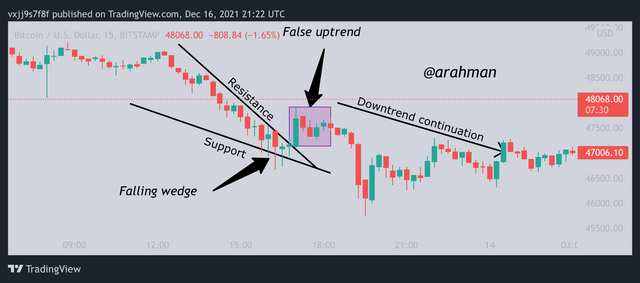
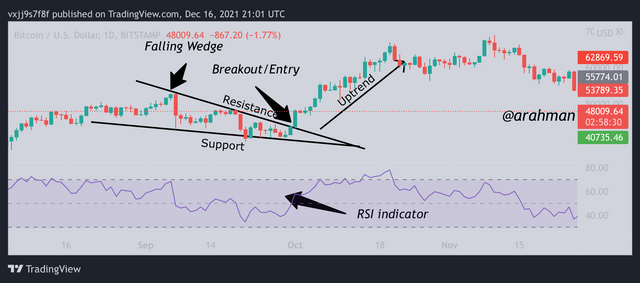
From the image above, we can see that there price movement continue to hit and bounce off the resistance and support Trendlines which forms a pattern in the chart. In this case, the pattern is a falling wedge pattern. After the falling wedge pattern, it is predicted that the trend breakout should be a downtrend but we can notice that there is a slight uptrend movement for some small period of time. This is a clear example of a false signal produce by the wedge pattern. Some investors may decide to place a buy order because of this wrong signal and after some time the market will shift to a downtrend causing them to lose their funds.
So because we want to prevent such a case from happening, it is advisable to add another indicator to the chart so that you can gain a more correct reliable analysis from the chart. With this, I have decided to add the RSI INDICATOR (Relative Strength Index) to the chart. The RSI indicator signals for market entry when the RSI value falls below 30, meaning a bullish trend is anticipated. Also when the RSI value is above the 70 mark, it signals for an overbought region which means the market is likely to move in a downtrend. With this knowledge, we can apply it with the wedge pattern to correct some of the false signals produce.
 BTC/USD chart fromTradingView
The image above shows a chart with the application of both wedge pattern and RSI indicator. From the wedge pattern a bearish breakout is anticipated and it can be confirmed by comparing to that of the RSI indicator. The RSI Indicator shows an overbought region, meaning a bearish movement is expected soon. And this is how we can attain more accurate analysis with the use of the wedge pattern.

Question 4: Show full trade setup using this pattern for both types of Wedges.( Entry Point, Take Profit, Stop Loss, Breakout)
Trade Setup using Rising Wedge
 BTC/USD chart fromTradingView
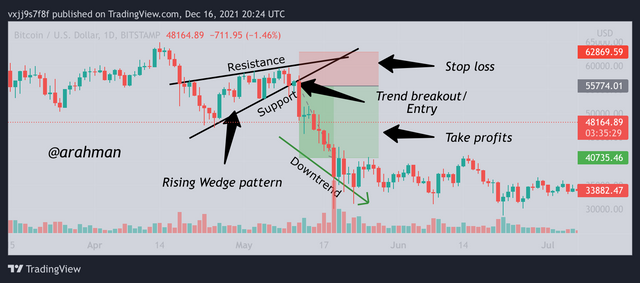
In the image above, it demonstrates the price movement of BTC/USD chart. It can be noticed that the movement occurs between the Trendlines of the rising wedge pattern. It hits and bounces off the Trendlines until it reaches its apex, thus the end of the bullish period. At this rate, it signals for a trend breakout in which the market shifts to a downtrend. The trend breakout point is also the market entry/exit point. So the sell order is placed just after the breakout point. Now all I have to do is set my stop loss slightly over the resistance level and also set up my take-profits.

Trade Setup using Falling Wedge
 BTC/USD chart fromTradingView
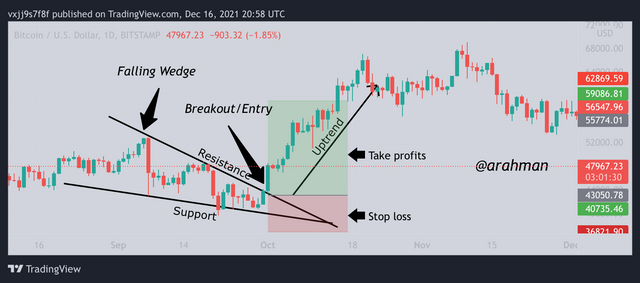
In the image above, it demonstrates the price movement of BTC/USD chart. It can be noticed that the movement occurs between the Trendlines of the falling wedge pattern. It hits and bounces off the Trendlines until it reaches its apex, thus the end of the bearish period. At this rate, it signals for a trend breakout in which the market shifts to an uptrend. The trend breakout point is also the market entry/exit point. So the buy order is placed just after the breakout point. Now all I have to do is set my take-profits significantly over the resistance level and also set up my stop loss a bit lower than the support level.

Conclusion
Wedge pattern is yet another useful pattern observation that in which the two lines of resistance and support meet at point of convergence in the middle of a trending market. The formation of wedge patterns helps investors analyze and make proper decisions when trading. The different types of wedge patterns can also help us identify trend reversals and continuation in the market.
From my experience, I have learned that the wedge pattern is not 100% reliable since it may give out false signals. With this, it is very necessary to accompany it with another indicator in order to correct these false signals.
Thank you once again professor @sachin08 for this informative lesson and I hope to learn more from you in the next lessons to come.