Steemit Crypto Academy Season 3-Week 7 | Trading Crypto With Average Directional Index (ADX) Indicator | Homework for professor @kouba01

Questions to be answered in this homework-
Discuss your understanding of the ADX indicator and how it is calculated? Give an example of a calculation. (Screenshot required)
How to add ADX, DI+ and DI- indicators to the chart, what are its best settings? And why? (Screenshot required)
Do you need to add DI+ and DI- indicators to be able to trade with ADX? How can we take advantage of this indicator? (Screenshot required)
What are the different trends detected using the ADX? And how do you filter out the false signals? (Screenshot required)
Explain what a breakout is. And How do you use the ADX filter to determine a valid breakout? (Screenshot required)
What is the difference between using the ADX indicator for scalping and for swing trading? What do you prefer between them? And why?
Conclusion:
Question 1.
Discuss your understanding of the ADX indicator and how it is calculated? Give an example of a calculation. (Screenshot required)
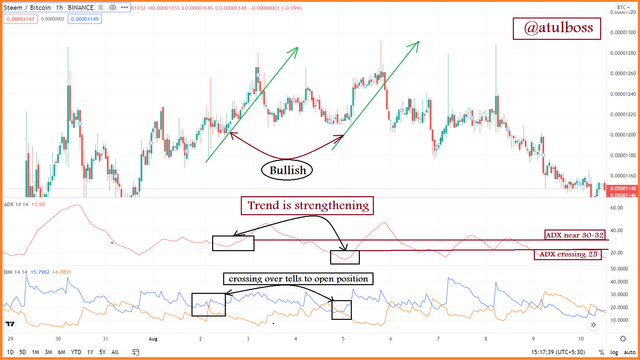
The ADX stands for "Average Directional Movement Index" which simply means it is the average of DMI. This is actually a trend strength-based indicator that tells us about the potential of a particular trend. No matters whether it is trending bearish or bullish, a rise in levels of ADX gives the strength of the trend. A good trader never jumps opposite to the trend and, to decide to jump into the market more certain, ADX can help us a lot.
Now, moving towards technical terms of the ADX indicator, it consists of one line which goes up at the time of increase in strength of a trend called as "TRENDING MARKET" and goes down at the time when the market loses the trends and moves towards "NO TRENDS".
ADX has some levels from 0 to 100 in between ADX moves. Let's understand from the table below, how it works,
| ADX Scale | Nature of strength |
|---|---|
| 0 - 25 | No trend |
| 25 - 50 | Strong |
| 50 - 75 | Very strong |
| 75 - 100 | Extremely strong |
- So, we understood from the above table that ADX is lying at below 25 value, it is NO TRADE zone because there are no trends present in the market and the market is moving in sideways. There is no surety about the direction that where the market will move next or it will stay sideways for more time.
- If ADX is crossing the 25 levels, that means there is a trend developing in the market. Again, please note that we only get the information of trend development, not the trend's nature (bullish/bearish). Nature can be known by the use of other indicators which is trend-based. If ADX is rising above 25, this indicates the trend is getting stronger. This is the point where traders may enter the market to earn a good profit.
- If ADX is lying between 50 to 75 levels, this indicates a very strong trend, which tells a trader may hold his position.
- If ADX is above 75, this means the market is at a very strong trend. At this point, a trader must keep an eye on the ADX. If ADX value is getting reversal this doesn't mean that market is reversing. ADX make a reverse when the strength of trends change.
Note: I have taken ADX and DMI separately on the chart so that effects can be visualised clearly.
- 1st indicator- ADX
- 2nd indicator- DMI
-DI+ =Blue line
-DI- =Orange line
#Calculation of ADX indicator
Before calculating the ADX, I will calculate the DMI because the value of ADX comes from the difference in the value of positive and negative DMI. Larger the difference in DMI, the wider the graph of DMI and the greater the value of ADX. So, let us now calculate the +DMI, -DMI, True Range, +DI, -DI and DX, then finally I will calculate the value of the ADX line.
- Positive DMI & Negative DMI-
DMI+ = (Current High - Previous High)
DMI- = (Previous Low - Current Low )
If the value of positive and negative DMI comes negative, then the overall final value becomes automatically equal to zero.
- True Range
There are some formulae to find the value of True Range.
- Current High - Current Low = X
- Current High - Previous Close = Y
- Current Low - Previous Close = Z
From the three formulae, we will get three values. I have named it X, Y and Z. Out of X, Y and Z, the bigger value becomes True Range.
- DI+ and DI-
Formula for finding the DI+ and DI- are:
DI+ =DMI+/True Range
DI- =DMI-/True Range
- Calculation of Directional Index (DX)
DX = | +DI - DI - | ÷ | +DI + DI -|
Now, after finding these data, Now I am moving towards finding the ADX,
ADX = Sum of the number of period × [((DI+) - (DI-)) / ((DI+) + (DI-))] / n
ADX = Sum of the number of period ×DX/ n
Whatever value will come for ADX, this will be visible on the ADX line representing that value.
Question 2.How to add ADX, DI+ and DI- indicators to the chart, what are its best settings? And why? (Screenshot required)
As the Tradingview website is one of my favourites, I will choose the chart from Tradingview.
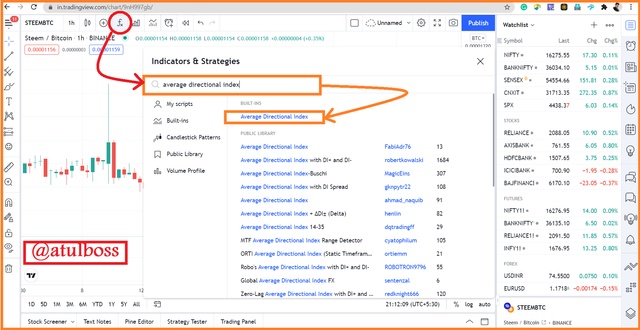
Step 1: Open the chart of any asset, I am choosing the STEEM/BTC pair.
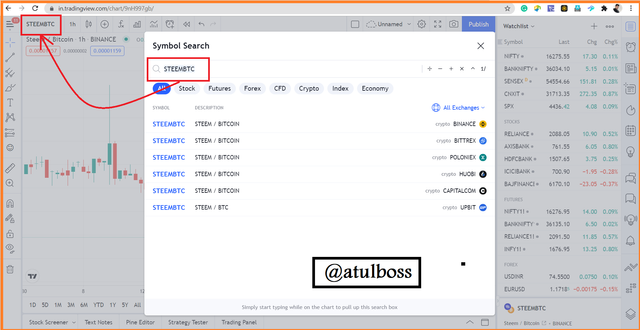
Step 2: Click on the fx and type Average Directional Index or ADX and add this indicator.
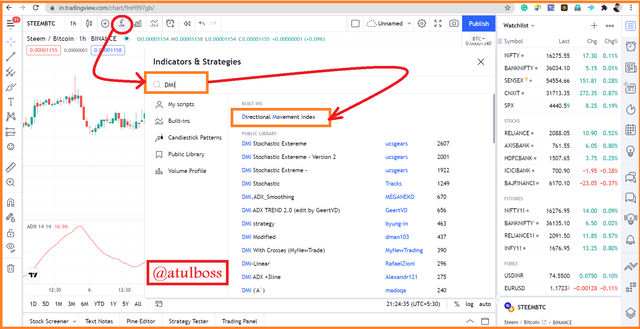
Step 3: Also, type Directional Movement Index or DMI and add this indicator.
- Best Settings for ADX & DMI:
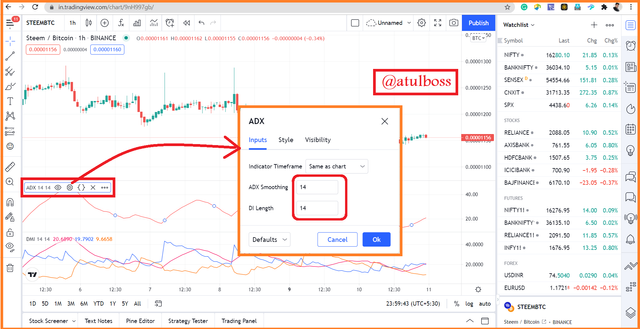
Here it is shown that the default setting of ADX and DMI is 14. In the default value of the ADX and DMI, the value will be calculated from 14 candles. This is considered the best value for normal trading but most of the traders also use different settings other than the default. This needs higher practice over ADX and DMI because putting lower value in setting create multiple false signals and putting high value in setting create slow and fewer signals from which there are chances of missing entry at good positions.
- Short period of ADX and DMI
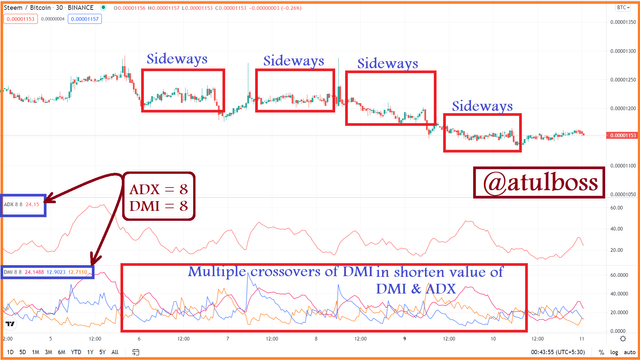 Short-term traders and scalpers mainly use this type of setting. Very low indicator settings create multiple signals and capture the trend volatility. Scalpers can use this setting because they trade for a very short time irrespective of the profit or loss.
- Long period of ADX and DMI
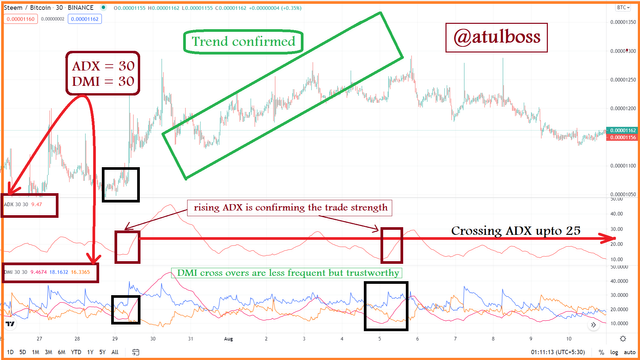
This type of setting is mostly used by long term traders. It is considered more trustworthy as it creates fewer signals but in the screenshot, we are seeing that signals produced by DMIs are genuine and its strength is confirmed by ADX.
There is a problem in using a long period in setting that signals strength are confirming little delay, so, there is a chance of missing out signals or delay entry. While using a long period in the setting of ADX and DMI, it creates signals when it is very strong. To avoid the missing out of signals we should add other indicators also.
Note: I have added ADX and DMI separately for clear visualization and understanding.
Question 3.
Do you need to add DI+ and DI- indicators to be able to trade with ADX? How can we take advantage of this indicator? (Screenshot required)
Yes! We definitely need to add DI+ and DI- indicators to trade with ADX.
We can not decide the nature of the trend on the basis of ADX signals. We will only get "how powerful the trend is" but without knowing the proper direction this will be very difficult to take our position in the market.
We get proper information about the direction of the trend by watching the crosses over of DI+ and DI-.
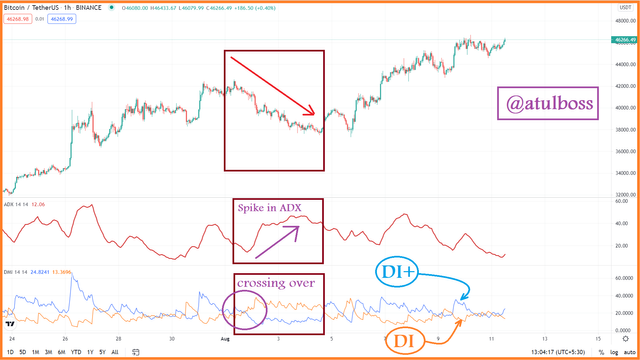
In the above screenshot, I have hidden the ADX line from the DMI and taking it separately for clear visualization. All the input settings are kept as default.
In BTC/USDT chart, we are clearly observing that when DI- lines (coloured orange) crosses DI+ (blue coloured) and moves upside over DI+, leaving DI- on the bottom, It is a clear signal of SELL.
Now, at the same point, we are also observing that the ADX lines spiking upwards and crossing 25 levels and moving towards 48 levels. This is indicating that the signal is getting stronger.
Now, suppose for a condition, if we apply only ADX, it will show upward direction for a bear market. This will become very confusing for the traders whether to BUY or SELL.
For another condition, if we apply only the DMI indicator, It will show a cross over, but we will not be sure that whether it is a strong signal or a weak signal.
We can take the advantage of the indicator by looking at crossing over of DI and observing signal strength as mentioned above.
- My personal opinion with the ADX indicator is that it is better to take the trade when ADX is spiking upwards because it confirms the signals getting stronger. But when the ADX line is coming down, it does not guarantee sideways or any trend. Normally, ADX comes downwards when there is a reduction in the strength of a trend.
Question 4.
What are the different trends detected using the ADX? And how do you filter out the false signals? (Screenshot required)
ADX indicator involves tracing the strength of the trend. Let's see one by one how many types of trends are detected by using ADX indicator.
a). No Trend/weak or neutral trend:
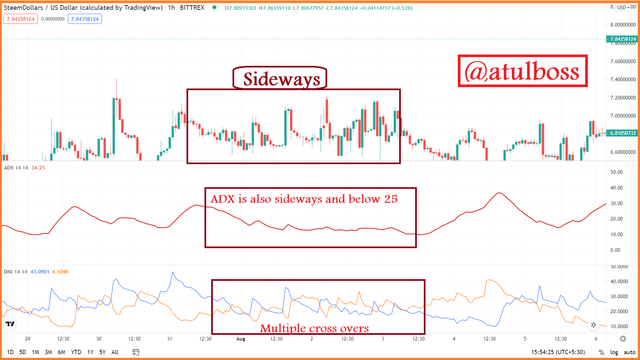
We have already seen above in a table that when ADX stay below 25, it tells about there is no trend in the market and market movement is sideways.
This is the point of NO TRADE ZONE for the traders because at that point no one knows about the next step of the market.
I have taken an example of SBD/USD when ADX lying below 25 levels and confirming a NO TREND signal.
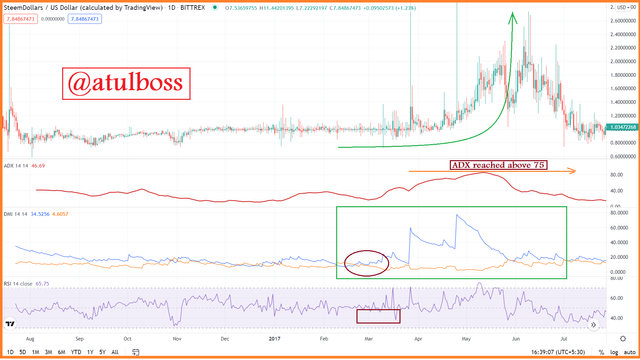
b). Strong trend:
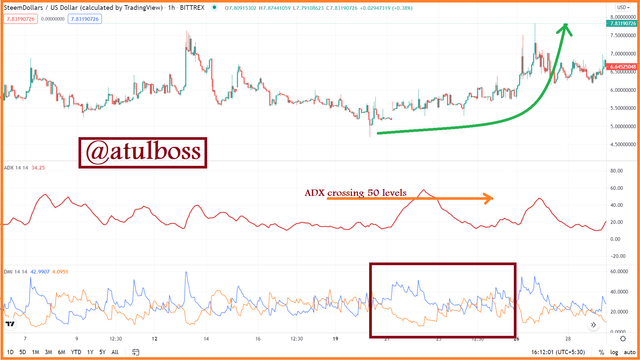
In the above screenshot, ADX is crossing the 50 levels which are indicating a strong trend in the market. We can make an entry hereby confirming the crossing over of DI. Crossing of the blue lines indicating that this is a BUY signal and ADX is confirming its strong trend.
c). A very strong trend:
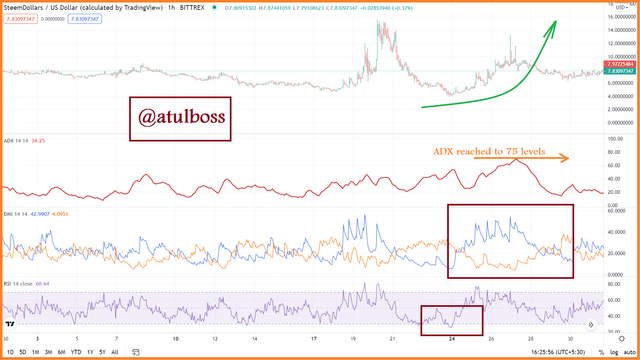
In the above screenshot, ADX reached 75 levels which are indicating a very strong trend in the market. We can make an entry hereby confirming the crossing over of DI. We can also use other indicators for confirmation at this point. I am adding the RSI indicator for its confirmation. We can easily see in the screenshot that RSI is in 30 levels which are also called an oversold zone. So I am now double confirmed here that I will buy at this point.
d). Extremely Strong Trend:
In the above screenshot, ADX crossed the 75 levels and reaching towards 80. This is identified as Extremely Strong trend. At this point, there are high chances of reversal also due to an increase in the volume. A trader should watch the support and resistance and act accordingly to maximise his profit.
- Filter false signals
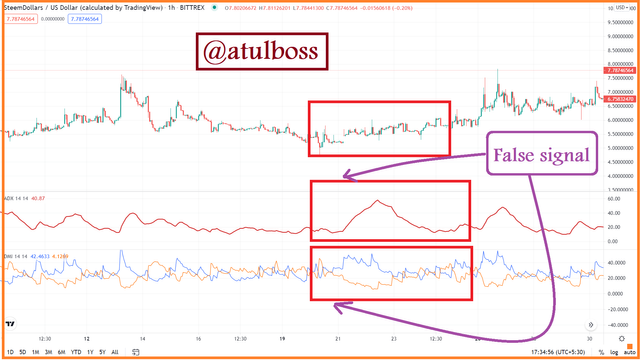
Sometimes, ADX and DMI give signals which are not matched with the candlestick movement at that time. In the above screenshot, DMI is showing the cross over in a bullish pattern, ADX is showing upward movement which is indicating the trend is getting stronger but the real market is moving sideways.
In such conditions, we need other indicators like RSI or MACD to confirm the entry.
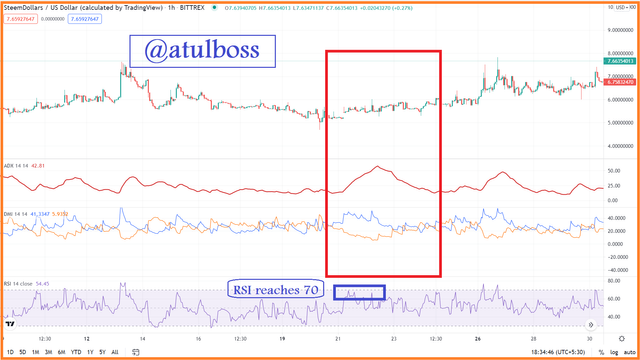
The above screenshot is showing RSI levels. RSI reached 70 which is an overbought zone that means BUYING here is not a profitable decision.
Question 5.
A breakout is the situation where a market movement breaks the resistance or support line and continue moving in that direction.
Explain what a breakout is. And How do you use the ADX filter to determine a valid breakout? (Screenshot required)
A breakout can happen in either direction and that can be identified by a change in the volume of assets.
Breakout in the upward direction is due to an increase in buying pressure and breakout in the downward direction is due to an increase in selling pressure.
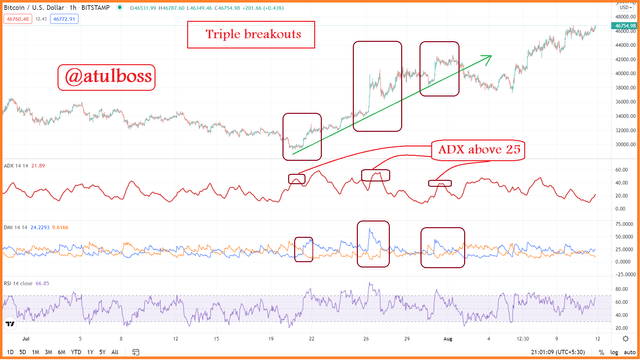
Here, in the above screenshot of BTCUSD, it is clear that this is a genuine breakout. All the indicators used here are giving the confirmation of a bullish breakout. ADX value is above 25 which means the market is developing some trend. DM+ is moving above the DI- after crossing 3 times and causing three breakouts simultaneously.
- We can use the ADX filter to determine a valid breakout-
Sometimes, a market breaks the support or resistance for a very short time and return to its previous position. This is called Fake breakout.
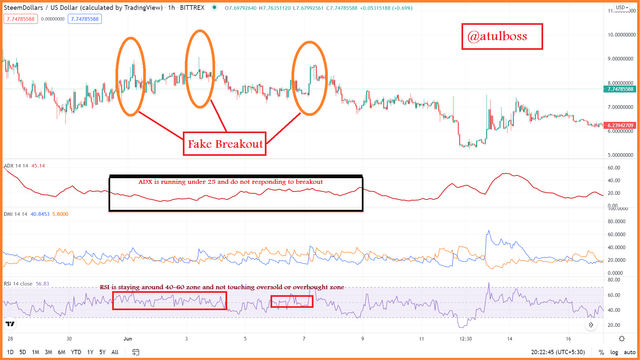
We can check that particular breakout is valid or not. In the case of fake breakout different indicators behave differently.
In the above screenshot, we are able to see three fake breakouts in the SBDUSD chart. In all of the fake breakouts, one thing is common that ADX has no visual movement on either side. RSI is also moving in 40-60 levels.
In such way, a valid breakout is ensured.
Question 6.
What is the difference between using the ADX indicator for scalping and for swing trading? What do you prefer between them? And why?
ADX indicator is a universal indicator that can be used for both Scalping trade as well as Swing trade but it works by setting different setting for different trade pattern and trader's suitability. Sometimes, adding other trend based indicators also helps to confirm signals given by ADX. - ADX indicator, if used for scalping, we should use it with the DMI so that we can also get to know the direction of trend as ADX tells only about the strength of trend. In scalping, the trade is taken for very small duration so that small and quick profit can be taken. We have also seen in above questions that how low period setting gives many false signals. So, additionally adding the MACD indicator with DMI and ADX is the best idea to reduce the percentage of false signal.
- In swing trade, we enter the trade for little longer time so we set the ADX and DMI according to it. Setting the ADX and DMI in longer time frame gives reliable signal and reduces the false signal to much extent. Also, in such case, use of multiple indicators is not needed but if a trader want to use it, he may use some indicators which can tell about support and resistance like Pivot Point, so that proper entry and exit point can be determined to maximise our profit.
Question 7. Conclusion
From the above assignment, we learnt that using ADX indicator alone is not a good idea. For better results we should combine other indicators like DMI so that nature of trend can also be identified. If a trader want to enhance more quality of ADX indicator, using RSI or MACD with Pivot Point can also be used to confirm the trend as well as support and resistance for taking proper entry and exit. I also learnt the calculation behind ADX indicator and DMI, it was quite difficult for be but after learning this now I can easily calculate the data manually.
In this homework, I learnt to figure our fake signals and false breakout which is very important in trading because it sometimes it becomes very important to save our capital than to earn money.
With this, I would like to thanks @kouba01 for this amazing lecture. Dear sir, keep guiding us with different trading skills.
That's all from my side!
Thanks for reading.
Hello @atulboss,
Thank you for participating in the 7th Week Crypto Course in its third season and for your efforts to complete the suggested tasks, you deserve a 6/10 rating, according to the following scale:
My review :
An acceptable work in which the topic was discussed in all its aspects through answers of varying accuracy, some of which lack depth in the analysis, which loses the work's critical dimension in some paragraphs.
Your presentation of ADX indicator was simplified and clear but you did not provide an illustrative and practical example of how to calculate it.
Determining the best settings mainly depends on the trading strategy that the trader is willing to use.
The ADX can be used without the DMI, but the DMI makes it easier to read the indicator. The DMI shows the direction of the market. How it works is that it measures highs and lows over a period of time.
You did not well explain how it is possible to extract the false signals based on ADX indicator.
The rest of the questions did not go into depth analysis.
Thanks again for your effort, and we look forward to reading your next work.
Sincerely,@kouba01
Thanks sir for evaluating my homework :)