Crypto Academy / Season 4 / Week 2 - Homework Post for Professor @reminiscence01 - Topic: Technical Indicators.
Hello, everyone!
This is my fourth season with the cryptoacademy community, and it has been a great journey so far. The third season on cryptoacademy was a thrilling ride which saw tutors like professor reminiscence01 guiding steemians through the rocky paths of trading and Cryptocurrencies in general.
Although this is the second week on cryptoacademy, professor reminiscence01 kicked it off with the topic "Technical Indicators" where he successfully discussed technical indicators as one of the technical analysis tools which can help traders understand the movement of crypto prices in the market.
Without wasting much time, I will be responding to the questions asked in professor reminiscence01's lecture post.

Q1a. In your own words, explain Technical indicators and why it is a good technical analysis tool.
Technical indicators can simply refer to technical analysis tools that are mathematical calculations depicted as patterns based on previous price movements, trading volumes, or open interest information which have repeatedly occurred with a similar outcome over time .These technical indicators are very important because they help technical analysts to forecast financial market directions and trade with a higher probability of making profit.
Q1b. Are technical indicators good for cryptocurrency analysis? Explain your answer.

source : pixabay
In my opinion, Yes!
Technical indicators are actually very good technical analysis tools to be used in trading because the working principle of these technical indicators is based on the psychology of traders and forces of demand and supply which affected price movements in the past. Despite how volatile the prices of cryptocurrencies are there is still a higher probability that they would still react in a similar way to previous scenarios which reoccur in the future, hence the usefulness of technical indicators in identifying these scenarios for future reference.
Q1c.Illustrate how to add indicators on the chart and also how to configure them. (Screenshot needed).
As my previous research has shown there are certain steps which must be followed in order to successfully add an indicator to your chart. In this section we will be using the Trading View chart as a case study. These steps are as follows;
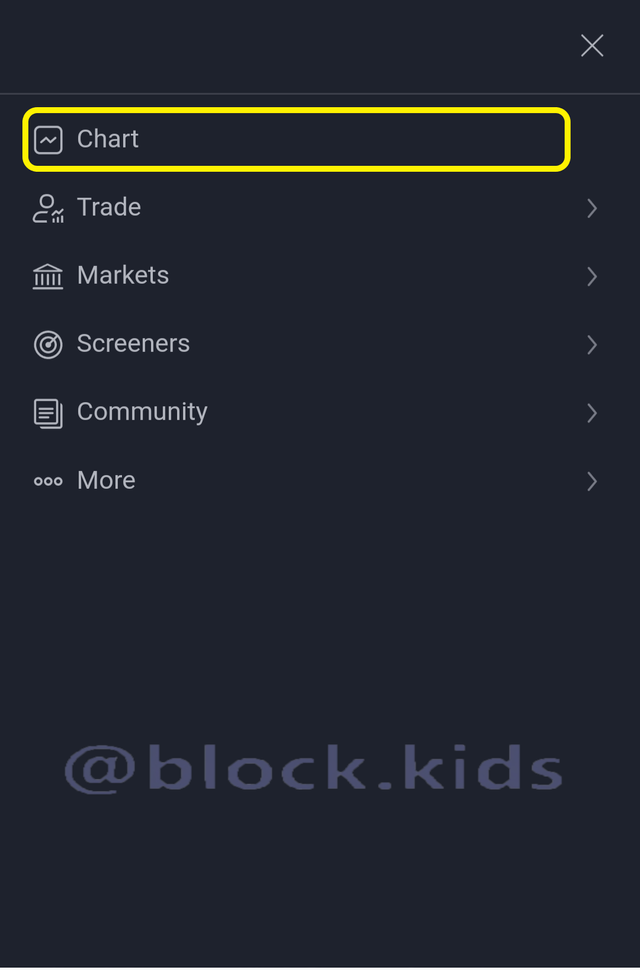
Step 1: visit TradingView.com on your browser, tap the menu icon (the three horizontal dashes) located at the top left corner of the screen, click on the ‘Chart’ tab and access the charting interface.

Step 2: On the charting interface, click on the indicator icon located at the top of the page
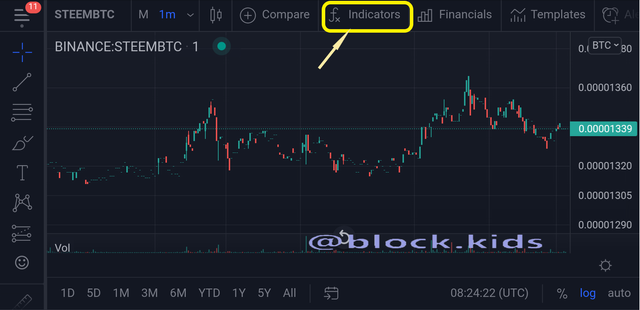
Source :screenshot
Step 3: The indicator icon will pop-up a window containing various types of Technical indicators on trading view. These Technical indicators on display include both user customized and built in indicators.
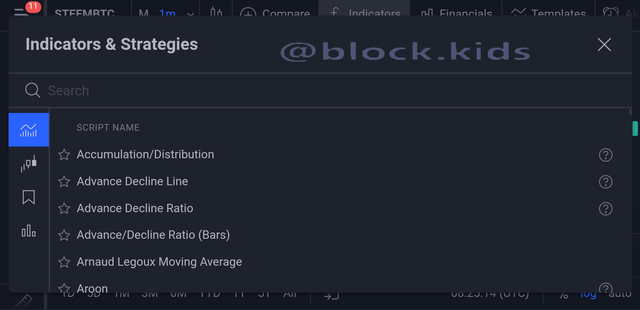
Source :screenshot
Step 4: In order to access your desired indicator, type its name into the search box located at the top. Then all the available scripts will be displayed.
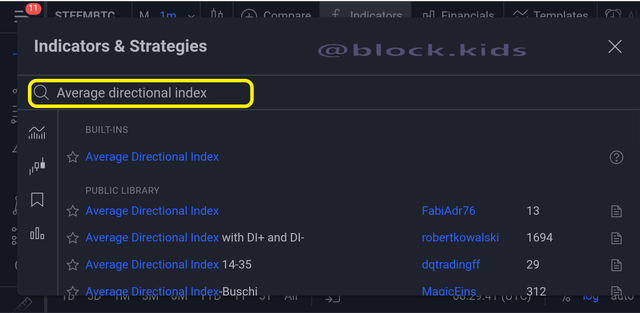
Source :screenshot
Step 5: Click on your most preferred indicator. It will then be added to the chart. As you can see in the screen shot below, I added the Average Directional Index indicator.
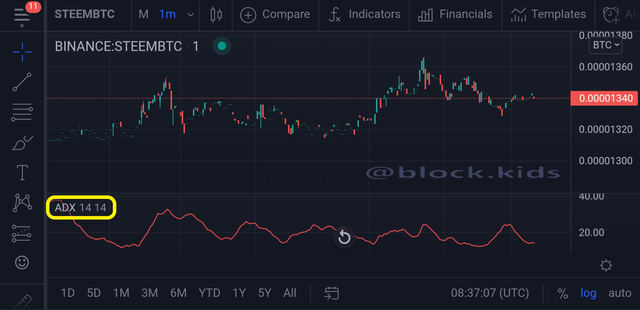
Source :screenshot
Meanwhile, to make effective use of Technical indicators, it has to be well configured. Here are simple steps to follow when configuring an indicator.
Step 1: Click the indicator figure on the chart and an indicator bar will pop up.
Source :screenshot
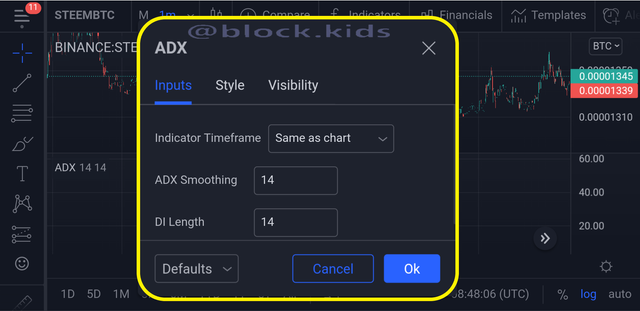
Step 2: Click on the settings icon. A pop-up window will appear displaying the configuration of the indicator. Here you can configure the indicator parameters, color, font size, etc. And make the indicator user defined.
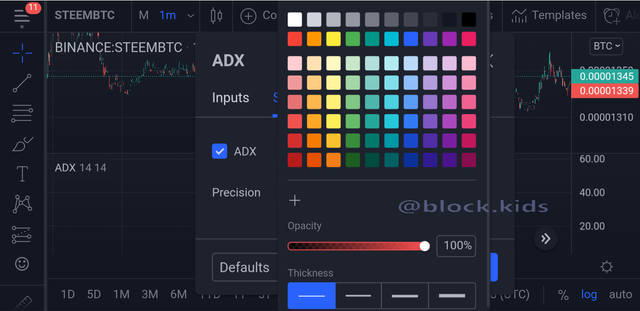
Source :screenshot
Q 2a. Explain the different categories of Technical indicators and give an example of each category. Also, show the indicators used as an example on your chart. (Screenshot needed).
There are different categories of technical indicators and each category uniquely resonates with various trading methods crypto investors and traders use in making trading decisions. The Technical indicators categories are as follows;
Trend Based Indicators
Volatility Based Indicators
Momentum-Based Indicators
I will briefly be explaining each of these categories.
Trend Based Indicators
Trend Based Indicators simply measure the strength and direction of a trend by using price averaging to determine a baseline which will be used as a reference. Usually, if price rises above that baseline the trendcould be described as a bullish trend, however if vice versa is the case then it will signal a bearish trend. Examples of trend Based Indicators include;
Parabolic stop and reverse (Parabolic SAR)
Ichimoku Kinko Hyo
Moving Averages ( Simple/Exponential)
Average Directional Index (ADX).etc.
Example of Average Directional Index (ADX) indicator on the chart.
Source :screenshot
Momentum-based indicators
Momentum-based indicators also known as Oscillators are indicators used to analyze how far the price of an asset has traveled. This Analysis is done by identifying the speed of price movement, comparing the current closing price to previous closing prices. Understanding the momentum of the market helps relate when the price of an asset is overbought or oversold to traders. Hence, Investors can capitalize on this knowledge and predict the future prices of assets.
Examples of Momentum Based Indicators include;
- Stochastic Oscillator
- Commodity Channel Index (CCI)
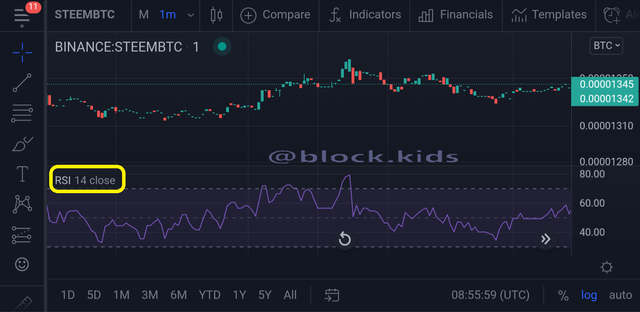
- Relative Strength Index (RSI).
- Moving Average Convergence Divergence (MACD), etc.
Example of Relative Strength Index (RSI) indicator on the chart.
Source :screenshot
Volatility Based Indicators
The volatility-based indicators are indicators used for measuring the rate of price movement, regardless of direction. These price movements in the market could be referred to as market swings or Fluctuations in market prices. These fluctuations are indicated by seeing highs and low prices (upswings or downswings) on the chart. Traders can actually buy at low prices and then sell at higher prices. These volatility Based Indicators can actually be used to predict these points of high prices and low prices.
Examples of volatility Based Indicators include;
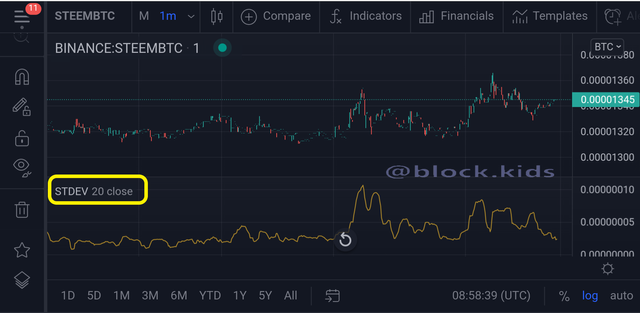
- Standard Deviation
- Bollinger Bands.
- Average True Range (ATR) and many others
Example of Standard Deviation indicator on the chart.
Source :screenshot
In the course of my research I went further to discover one more category of Technical indicator not mentioned in professor reminiscence01's lecture post. This category is the Volume based Indicators.
Volume based Indicators
These technical indicators measure the strength of a trend based on volume of that asset or commodity traded within a time frame.
These technical indicators help traders understand the strength of a trend by identifying market tops, market bottoms and market breakouts.
Examples of these volume based Indicators are;
- Chaikin Oscillator
- On-Balance Volume (OBV)
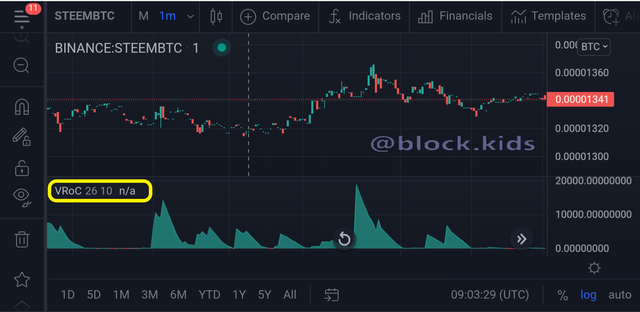
- Volume Rate of Change
Example of Volume Rate of Change indicator on the chart.
 Source :screenshot
Q2 b. Briefly explain the reason why indicators are not advisable to be used as a standalone tool for technical analysis.

source : pixabay
Indicators are not advisable to be used as a standalone tool for technical analysis because nothing in trading is 100% certain and the future of price action can be altered by a great number of circumstances that were not taken in consideration.
Let us consider a scenario where a trader makes a decision to sell his crypto assets after speculations from a Trend Based Indicator which signaled a downtrend immediately the price of that asset broke a baseline however, a whale wanted to capitalize on the excessive loss in value of that specific crypto assets and buys a huge quantity of the crypto asset causing a sharp and unforeseen trend reversal.
Honestly, every technical indicator fails and understanding this reality drives professional traders to try increasing the probability of making profit by using multiple technical analysis tools in conjunction with technical indicators.
Q2c. Explain how an investor can increase the success rate of a technical indicator signal.

source : pixabay
As stated in the previous section, investors who are profit oriented can increase the success rate of their technical indicators by combining the use of several technical indicators.
Moreover, knowing the best combination of technical indicators can dramatically improve your chart reading skills and help you create effective technical analysis strategies which will result in an increase of profit earned per trade.
Although, all technical indicators are useful, they each have their own set of weaknesses but this weakness can be made up for by combining each technical indicator with other compatible and effective technical indicators.
For a more practical approach, in order to Increase the success rate of using technical indicators , a trader could make use of one momentum and one trend indicator; for example, using a Relative Strength Index (a momentum indicator) and an Average Directional Index (a trend indicator) would offer greater chances of making a successful trade.
Conclusion
Trading is always fun because you learn new things every day, although, it can get very sad when you make losses on a trade. For this reason, before a trader or investor makes a decision during a trade he should try to increase his success rate by performing a bulletproof technical analysis.
Some of the most efficient tools used in technical analysis are technical indicators. The use of these technical indicators when reading charts can go a long way to increasing the success rate of a trade.
However, Technical indicators do not ascertain that the trade will be a 100% success but the combination of multiple technical indicators can greatly increase the chances of making profit off a trade.
In conclusion, I will like to show gratitude to professor reminiscence01 and the whole cryptoacademy community for this opportunity to research and gain tremendous knowledge about technical indicators.
Hello @block.kids, I’m glad you participated in the 2nd week Season 4 of the Beginner’s class at the Steemit Crypto Academy. Your grades in this task are as follows:
Observations:
That's correct.
Recommendation / Feedback:
Thank you for completing your homework task.