Crypto Trading with Price Action- Crypto Academy / S6W2- Homework Post for @reminiscence01

Hello, everyone!
Welcome back!
It is a privilege to be writing once again on Steemit's Cryptoacademy platform.This is the second week in the sixth season at cryptoacademy. I hope for the duration of this season everyone will gain more useful knowledge , have fun and create more quality content.
What do you need to know about crypto trading with price action?
A brief expository to this question's answer is highlighted in professor reminiscence01 lecture article titled 'Crypto Trading with Price Action'.
With respect to the homework provided in the above lecture article, I will be sharing my perspective on some basic concepts anyone must understand while trading cryptocurrencies using Price Action.

Explain your understanding of price action?
What is price action?
In my opinion price action is simply the movement of price up and down the price chart. Price movements on a crypto price chart is influenced by so many factors including the actual demand and supply of the crypto asset in the market and the psychology and emotions of traders (buyers and sellers).Price action enables us to understand
How do people trade using Price action?
From what I have learnt so far in my trading experience, there are many techniques which price action traders employ when trading. Some of these techniques make use of some tools like, volume charts, price chart patterns, market structures support levels ,resistance levels , various technical indicators or a combination of more than one tool to predict the direction of price movement. In essence, price action traders use the aforementioned tools to understand the present market condition based on historical study of price movement before making trade decisions.

What is the importance of price action? Will you choose any other form of technical analysis apart from price action? Give reasons for your answer.
Why is price action important?
There are so many strategies and techniques used to analyze the market condition in technical analysis, however, price action is used by most traders when making trade decisions.
Price action is very important in the crypto trading ecosystem because traders irrespective of their experience level can use it to gain a better understanding of how the market works. Besides, with price action one can easily decipher the slight changes in psychology and emotions of the traders in the market. In addition, a trader can filter out false signals.
Will I be willing to drop Price action for any other technical analysis strategy?
Despite the availability of technical analysis strategies, I will not be willing to price action for any other one. The reasons for my decision are explained below.
- Price action is flexible: Price action is useful Irrespective of the kind of trading I practice as a trader, whether scalping, day trading, swing trading and positional trading. In addition, Price action tools can be used on any time frame of my choice.
- Price action is simple : For a beginner, price action trading is easy to understand and execute. In addition, there are no complex calculations and timestamp variations associated with using Price action trading.
- Price action helps me filter out noise and false signals that occur on the price charts:- Due to the fact that price action trading is feasible on different timeframes, a false signal on an hour timeframe chart can easily be detected when I use a 1day time frame to view the chart. In addition the cluster and noise produced in a ranging market can be easily filtered using the price action trading.
- Price action helps me Understand the market better: -Unlike many other trading strategies which are dependent on a formula, Price action trading helps me understand market structures, different chart patterns and also the emotions and psychology behind traders.
- Price action trading is perfect for risk management during trading:- With the knowledge of support and resistance levels when trading price action I am able to manage risk better when trading.

Explain the Japanese candlestick chart and its importance in technical analysis. Would you prefer any other technical chart apart from the candlestick chart?
What is the Japanese candlestick chart?
There are many charts used in trading ranging from the line chart to the hollow chart. Among all these charts the Japanese candlestick chart stands out. The Japanese candlestick chart is a chart made up of successive red and green candle sticks of various lengths which represent the movement of price.
Normally, a single traditional Japanese candlestick is meant to represent the trading session of a day but now it has been modernized to suit trading on different time frames.
Why is the Japanese candlestick important in technical analysis?
The Japanese candlestick has great importance in technical analysis because of its structural features which break down the financial information of a trading session.

Source :Trade pips
Above is an illustration of the Japanese candlesticks and here bodies of the candle labeled , open, close, high and low. You will also notice the color difference in candlesticks.
For the green (bullish)candle you will notice that the open is below the close. This means that price experienced a rise in that trading session with the high tip of the wick (high) showing the highest price reached in that trading session while the low tip of the wick (low) showing the lowest price reached within the trading session.
For the red (bearish)candle you will notice that the open is above the close. This means that price experienced a fall in that trading session with the high tip of the wick (high) showing the highest price reached in that trading session while the low tip of the wick (low) showing the lowest price reached within the trading session.
Furthermore, the length of the candles relates both the momentum of trade within a trade session. Candlesticks are important in technical analysis especially when unique candle sticks like engulfing , hammers and dojo candle sticks appear on the chart. These sticks can determine trend continuation or trend reversals.
Will I choose any other technical chart over the Japanese candlestick chart?
My answer is No! The reason for my answer is simply because no other chart provides clarity, orderliness and a wealth of price movement information like the Japanese candlestick chart.

What do you understand by multi-timeframe analysis? State the importance of multi-timeframe analysis.
What is Multi-timeframe analysis?
In my opinion multi-timeframe analysis is a technique used in price action trading to filter out noise and enter good trading positions with a tighter stop loss.
The multi-timeframe analysis is basically the viewing of a price chart on different timeframes. The longer timeframe price charts like the 4hours, daily, weekly and monthly can help a trader filter out noise and know the overall trend of price in the market.
However, the shorter timeframes like 1minute to 1hour helps the trader enter good trading positions with a tighter stop loss. In the shorter time frames it is easier for the trader to read the movement of price as candlestick patterns are more visible.
Below is an example of a price chart on two different time frames showing support and resistance levels, price trends and candlestick patterns.
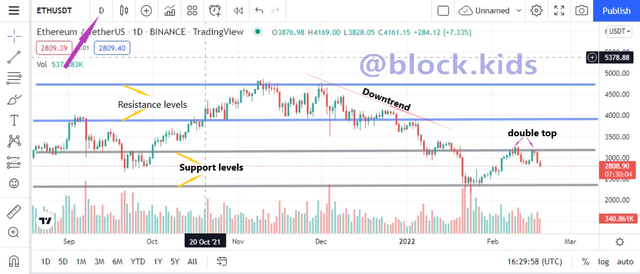 Source :Screenshot
The above chart is a ETHUSDT price chart displaying on a 1 day timeframe . You will notice that price trend ,support and resistance levels can be easily seen. The support and resistance levels are stronger than the levels on a shorter timeframe.
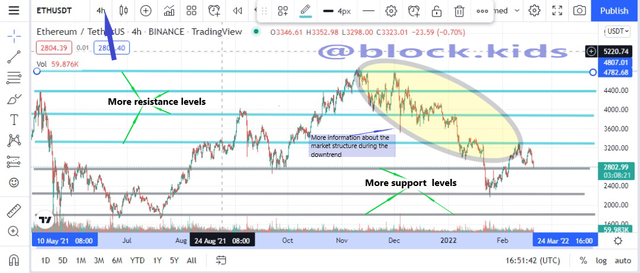 Source :Screenshot
Above is a screenshot of the same ETHUSDT price chart but the difference is that this chart is on a 4hr timeframe. You will notice an increase in the numbers of support and resistance levels. In addition, there is a distinctive detail on the market structure.
Why is multi-timeframe analysis important?
The importance of multi-timeframe analysis is not far fetched. Stated below are some of its importance;
- It helps the trader choose stronger support and resistance levels. Longer timeframes make stronger support and resistance levels while shorter timeframes make an increased number of support and resistance levels on the price chart.
- It helps a trader manage risk better when trading as tight stop losses can be attained with a reduced time frame.
- It helps the trader understand the market more and price trends and price action can easily be identified from different perspectives.
- It helps filter excessive noise and false signals in ranging markets.

With the aid of a crypto chart, explain how we can get a better entry position and tight stop loss using multi-timeframe analysis. You can use any timeframe of your choice.
How can we get a better entry position and tight stop loss using multi-timeframe analysis?
To better understand how to get a good entry position with a good stop loss let us consider this 1hr time frame chart below.
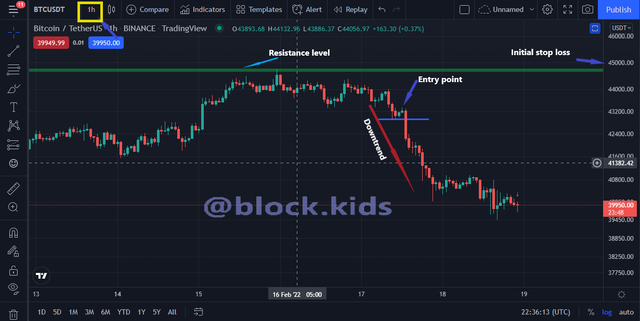 Source :Screenshot
From the BTCUSDT price chart above, if we placed a sell entry after the bullish inverted hammer candlestick, we will have a huge stop loss at 45000 which is about 1800 points from the entry price. To reduce this stop loss , we can reduce the time frame to a 15 minutes timeframe to get a good entry position.
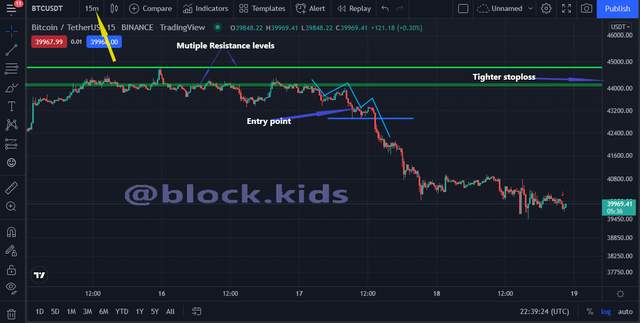 Source :Screenshot
The chart above shows the 15 minutes timeframe price chart of the same BTCUSDT currency pair . Here we can have a better entry on this timeframe and also a tighter stop loss. On the price chart we can see more resistance levels , therefore, if the stop loss is placed just above the nearest resistance level from the entry price, we have a stop loss of 44200 which is just 1000 points from the entry price. By switching to the 15min timeframe, we will now have a better entry position with a tighter stop loss of 1000 points.

Carry out a multi-timeframe analysis on any crypto pair identifying support and resistance levels. Execute a buy or sell order using any demo account. (Explain your entry and exit strategies. Also, show proof of transaction).
Trading using multi timeframe analysis.
In this section, I will be carrying out a multi timeframe analysis on the ETHUSDT crypto currency pair. On the price chart I will identify the support and resistance levels then analyze my trading strategy on different timeframes including 1hr and 15 minutes timeframes before executing a trade on a 3 minutes timeframe ETHUSDT price chart. The paper trading feature on the Tradingview platform will be used as a major tool in this section.
 Source :Screenshot
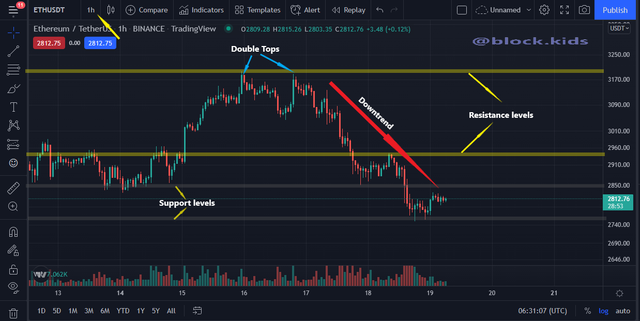
From the screenshot above, The ETHUSDT price chart is in a 1hr timeframe. The support and resistance levels are clearly identified. You will also notice the formation of a double top pattern which signifies a recent trend reversal from an uptrend to a downtrend. Therefore, price is gradually falling and entering a short (sell) trading position is advisable.
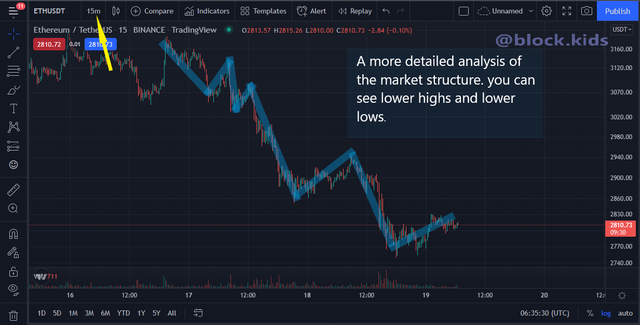
To get more information about the market structure, I displayed the ETHUSDT price chart in a 15 minutes timeframe.
 Source :Screenshot
From the above screenshot, you will notice the formation of lower highs and lower lows. Therefore, as there is no break in market structure, the previous high will be the perfect resistance level to reference when choosing a 'stoploss' price while the previous low will be the perfect support level when choosing a 'take profit ' price. In order to execute my trade with a tighter stoploss I displayed the ETHUSDT price chart in a 3 minutes timeframe.
Source :Screenshot
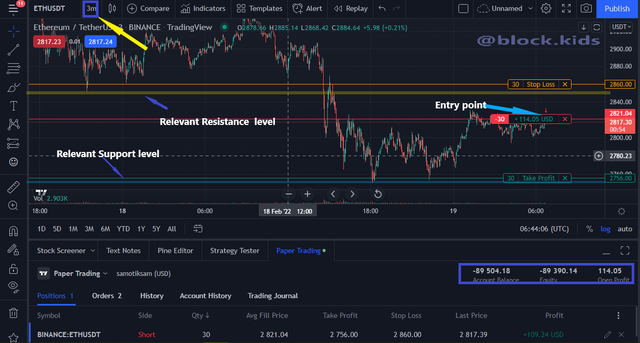
From the screenshot above, a sell trade is executed with relevant resistance and support levels acting as a guide to choose my take profit and stop loss prices.I entered a short position at 2821.04 , set my stop loss just above the resistance level at 2860.00 and set my take profit just above the support level at 2756.00.
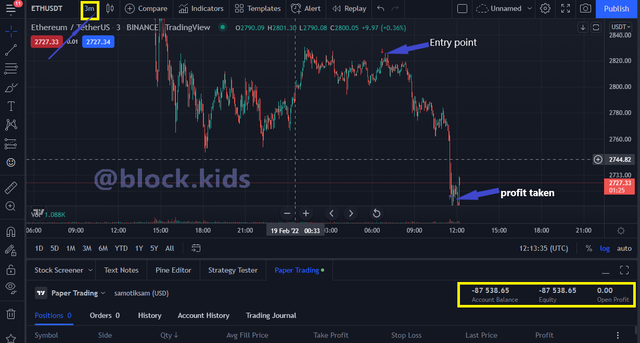
From the screenshot below, you can see the evidence of a successful trade as my account balance increased from -89504.18 to -87538.65.
 Source :Screenshot
Do not get confused about the minus sign in front of the balance, the are both negative values. To avoid this from occuring again I will always reset my paper trading demo account before carrying out a new exercise.

Conclusion.
Trading using Price action is one trading technique which no trader can do without.Its versatile nature increases the chances of the trader making a profitable trading decision.
Furthermore, the combination of the price action technique and the Japanese candlestick chart allows the trader to better understand how the market works and how to trade with an edge.
Finally, every trader should employ the use of multi-timeframe analysis as it provides the trader with more insight on how to trade better with a high level of risk management.
I am honored to be part of this session in Steemit's Cryptoacademy, I hope for more informative lectures in the future.

Hello @block.kids, I’m glad you participated in the 2nd week Season 6 at the Steemit Crypto Academy. Your grades in this task are as follows:
Observations:
Recommendation / Feedback: