Reading Special Bar Combinations - Crypto Academy / S5W8 - Homework Post for @sachin08

Hello everyone!
This is the final week of activity in the cryptoacademy- Season 5.
Throughout Season 5, we have learned various aspects of trading using patterns including trading with triangles, flags, rectangles, and wedge patterns.
However, in Professor Sachin08's final lecture for the season, we were introduced to a new concept of trading with bars.
This homework post will explain more about trading with bars as it completes tasks found within the lecture post titled "Reading Special Bar Combinations"

Task 1
Explain Price Bars in your own words. How to add these price bars on Chart with proper screenshots?
What are Price bars?
In my opinion price bars are just like candlesticks on the trading chart. A price bar represents an illustration of the price action of a crypto asset within a specific timeframe (it may be 1 minute or one 1day) depending on the trader’s choice. Although it does not look like a candlestick, it is still used to represent the effects of supply and demand within a trade session. The price bar, just like the candlestick is characterized by high, low, open, and close price positions just as shown in the illustration below
How Do You Add Price Bars on a Trading Chart?
On the Tradingview platform Price Bars can be added following these few easy steps;
- Step 1: On the tradingview homepage click on 'Charts'
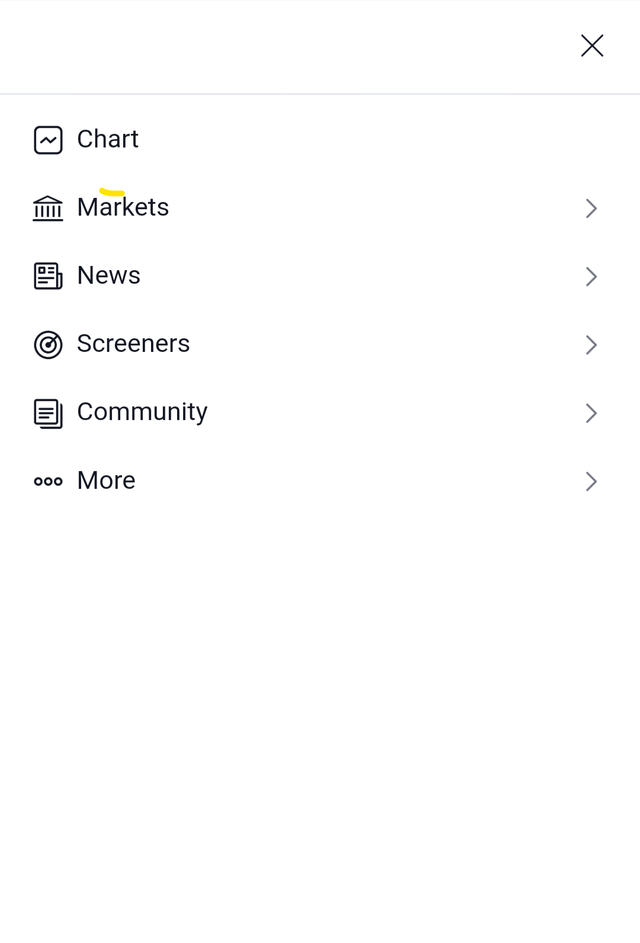 Source :screenshot
- Step 2: Next, Click on the 'Candles logo'. There will be a drop-down menu showing different options. Select Bars, then you have successfully added the Price bar to your trading chart.
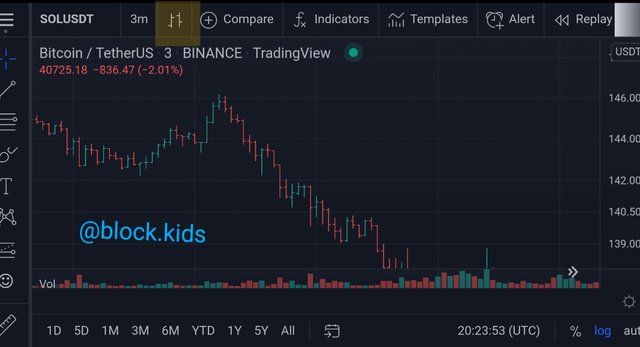 Source :screenshot
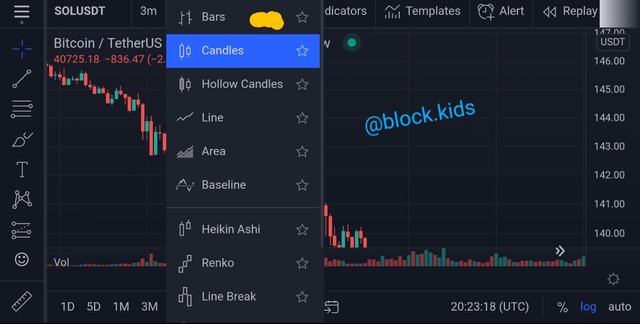 Source :screenshot
Task 2
How to identify trends using Price Bars. Explain both trends. (Screenshots required)?
How Do You Identify a Bullish Trend Using Price Bars?
A bullish trend is a general uptrend of price. However, just like using the candlesticks, there must be a prevalent price pattern formed and criteria met before a bullish trend can be successfully identified when using Price bars.
This prevalent price pattern will display a series of higher highs together with higher lows when using Price bars. This is to say that, usually during a bullish trend the new peak after minor retracement in prices will be always higher than the previous peak and the new trough at the end of a minor retracement in price will be higher than the previous trough. This is shown in the screenshot below.
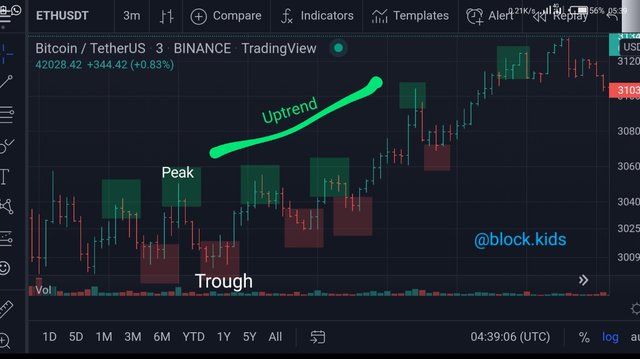 Source :screenshot
Some criteria will further confirm the identification of a bullish trend and some of them include;
Number of bullish price bars will outnumber the bearish price bars
New Price bars will mostly close at a higher price than the previous price bar.
You will notice a continuous unbroken series of higher highs and higher lows.
Note: minor retracements in price do not mean that a bullish trend has ended.
How Do You Identify a bearish Trend Using Price Bars?
A bearish trend is a general downtrend of price. There is usually be a prevalent price pattern formed and criteria met before a bearish trend can be successfully identified when using Price bars.
This prevalent price pattern will display a series of lower highs together with lower lows when using Price bars. This is to say that, during a bearish trend the new peak after minor retracement in prices will be always lower than the previous peak and the new trough at the beginning of a minor retracement in price will be lower than the previous trough. This is shown in the screenshot below.
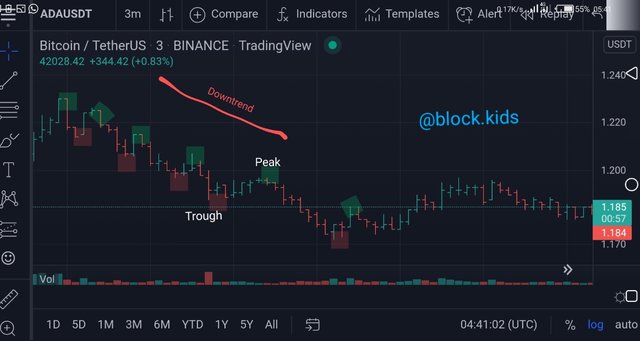 Source :screenshot
Some criteria will further confirm the identification of a bearish trend and some of them include;
- Number of bearish price bars will outnumber the bullish price bars
- New Price bars will mostly close at a lower price than the previous price bar.
- You will notice a continuous unbroken series of lower highs and lower lows.
Note: minor retracements in price do not mean that a bearish trend has ended.
Task 3
Explain the Bar Combinations for Spending the Day inside for both conditions. (Screenshots required)?
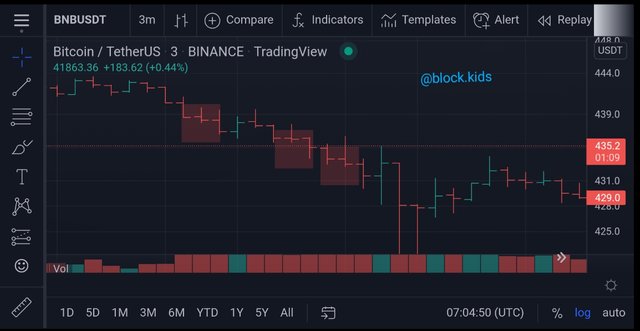
When each price bar represents a day, an inside day bar combination is formed where one Price bar is smaller and within the high to low range of the previous day's bar. In other words, the High of the new price bar is lower than the previous day's high, and the Low of the new price bar is higher than the previous day's low. An illustration of this bar combination is shown in the screenshot below.
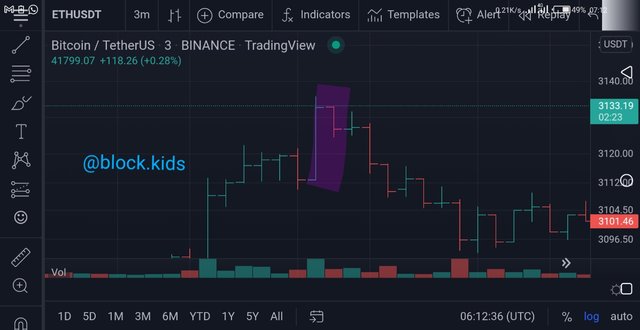 Source :screenshot
The inside day bar combination shows gross indecision in the market. Both buyers and sellers are unsure if the market will reverse or continue in its current trend.
Therefore, it is wise for a trader to not enter a trading position whenever the inside day bar combination is formed, irrespective of the ongoing trend.
Task 4
Explain the Bar Combinations for Getting outside for the Day for both conditions. (Screenshots required)?
In contrast to the inside day bar combination, the bar combination for getting outside is formed by two price bars. Here the more recent price bar exceeds either the high or low limit of the previous price bar. The high-low range of the bar is outside the range of the preceding bar.
Two conditions can help traders predict the future action of price in the market. These conditions are;
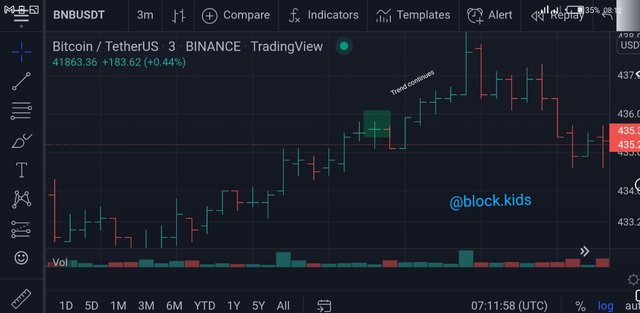
- When the Open is at the low and the Close is at the high:
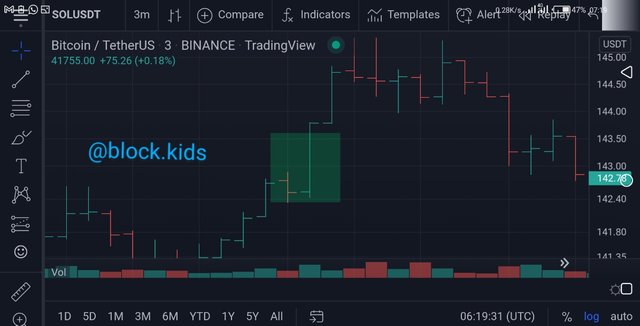 Source :screenshot
The screenshot above shows an illustration of this condition. This kind of bar formation means that buyers took over the market until the end of the day. However, the outside day has a higher high by definition which predicts a trend continuation when this formation occurs during an uptrend and a trend reversal during a downtrend.
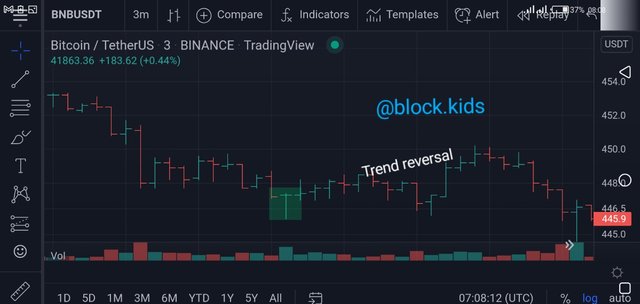
- The Open is at the high and the Close is at the low:
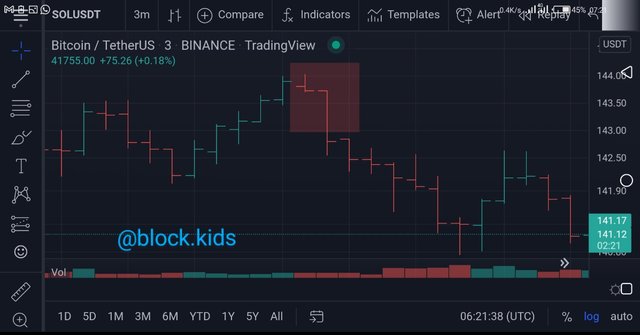
The screenshot above shows an illustration of this condition. This kind of bar formation means that sellers controlled the market until the end of the day. However, this ‘outside day' bar formation has a lower low by definition, therefore it predicts a trend continuation in a downtrend and a trend reversal in an uptrend.
Task 5
Explain the Bar Combinations for finding the close at the open for both conditions in each trend. (Screenshots required)
Another powerful bar formation that allows traders predict price action and trend progression is Finding the close and open price levels on the price bar at proximity to each other or even at the same price level.
With this kind of bar formation in a region within the price chart, a trader has a greater opportunity of predicting whether a trend will continue or reverse.
As shown in the screenshots above, whenever this kind of bar combination forms in a Downtrend, to successfully predict future price movements, check the position of the open and close levels on the Price bar. If the open and close are near the low, then the downtrend will most probably continue. However, If the open and close are near the high, then there will most probably be a trend reversal.
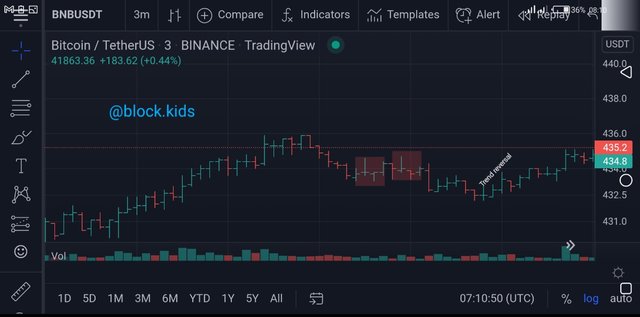
Similarly, as shown in the screenshots above, whenever this kind of bar combination forms in an uptrend, and the open and close price levels are near the low, then the downtrend will most probably reverse. However, If the open and close are near the high, then that is a strong signal that the uptrend will continue.
Conclusion
The use of price bars to represent price action on the trading chart is wonderful. The price bars are equipped with features that help relate comprehensive information to traders about crypto-asset price action or trend movement.
Although the price bars do not look like Japanese candlesticks, it is just as useful in identifying trend reversals and continuation signals.
I am really glad to be part of this lesson and I hope to participate more in the cryptoacademy.
Thank you for reading!
