Technical Indicators 2 - Crypto Academy / S4W4 - Homework Post for @reminiscence01
Hello guys!
Season 4 on the cryptoacademy has been great so far and this week was no different. Two weeks ago we were introduced to technical indicators as significant tools used in making decisions for trade in the crypto markets. At that time we dwelled of the types of indicators based on trend, momentum and volatility.
This week's lecture by Professor reminiscence01 guided us deeper into how to use technical indicators and other basic concepts like leading and lagging indicator.
Going further, I will be executing my homework in this post.

Q1.a: Explain Leading and Lagging indicators in detail. Also, give examples of each of them.
Technical indicators are generally classified into two categories namely;
Leading indicators
Lagging Indicators
Leading indicators
Leading indicators are those tools which help a trader predict future price actions. These type of indicators also fore warn traders of impending trend reversals. Leading indicators help minimize stop losses but they might not always be correct it is wise to not use a single leading indicator as a standalone reference point before entering a trade. Examples of leading indicators include Fibonacci retracements, Relative strength index, Donchian channels and Stochastic Oscillator.
Lagging Indicators
In contrast to leading indicators, lagging Indicators help traders identify trends shortly after the trend begins. These types of Indicators are majorly trend Based Indicators which tend to last for a longer period of time when compared to leading indicators. Lagging Indicators cause traders to maximize stop- loss orders, although, they are a more safer bet because they identify ongoing trends rather than the leading indicators which predicts future price action .Examples of lagging Indicators include moving averages, Bollinger bands, Parabolic SAR,MACD etc.
Q1.b. With relevant screenshots from your chart, give a technical explanation of the market reaction on any of the examples given in question 1a. Do this for both leading and lagging indicators.
There are so many indicators to choose from when trading. However in this post I will be reviewing an example of how price reacts to both leading and lagging Indicators. The two indicators I will be using are;
- Stochastic Oscillator (leading indicator)
- Bollinger bands (lagging indicator)
Stochastic Oscillator (leading indicator)
This is a momentum Based Indicator which can both act as as a leading or lagging indicator. However, this section will dwell around the concept of stochastic indicator as a leading indicator.
As a leading indicator, it is used to highlight when the price may be overextended and could reverse. Such highlighted areas are called oversold and overbought levels. As shown in the screenshot, whenever these levels intersect there is usually an immediate reversal in price trend action.
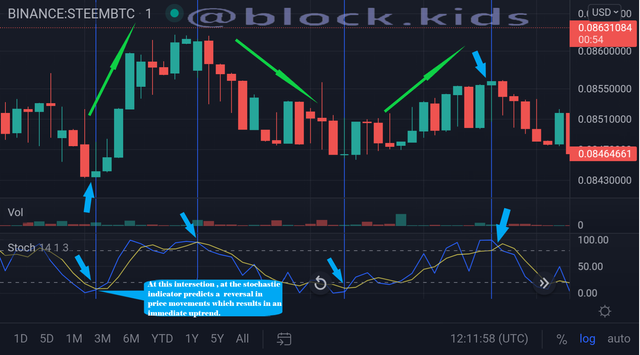 Source :screenshot
Using the Stochastic indicator to make trade decisions can be very helpful at times for a profitable trade, however, using it as a standalone reference point can be very dangerous as an intersection can sometime be a fake signal. This is shown in the screenshot below.
Bollinger bands (lagging indicator)
The Bollinger bands indicator is a volatility Based Indicator. This indicator consists of a moving average , upper layer and lower layer which helps identify areas of dynamic support and resistance as the price move within an ongoing trend. This is shown in the screenshot below.
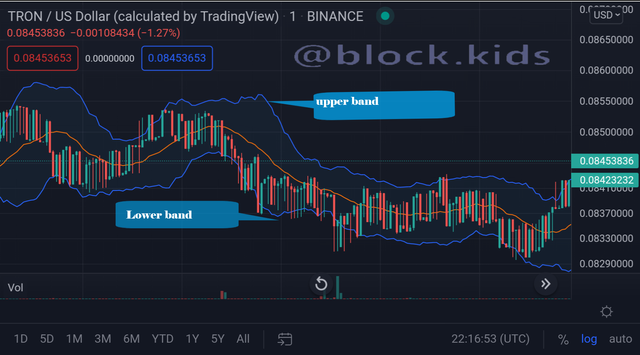
Source :screenshot
The Bollinger bands can also help traders make good trade decision. As shown in the screenshot below , During an ongoing down trend, taking short positions when the candle sticks intersect the upper bands there is a higher certainty the price will experience a drop but not below the lower band. However this is still no reason to use this indicator as a singular reference point.
Q2.a. What are the factors to consider when using an indicator?
Every trader wants to make profit. This desire is what drives every trader to use various tools to improve the chances of gaining success. Technical indicators are one of these tools, however there are certain factors you need to consider before using any set of indicators and These factors are as follows;
Market Trend
Type of Indicator
Formation of Confluences
Trading Strategy
Market Trend
"The trend is your friend."
Martin Zweig
Before using any technical indicator to analyze a market chart, The trader is advised to understand the market is experiencing an uptrend , downtrend or sideways trend (ranging).Understanding this factor can help the trader choose between momentum-based, volatility Based, or trend Based Indicators. Making use of the right category of indicator will help the trader follow the trend which creates a greater probability for a successful trade.
Type of indicator
There are over a hundred technical indicators which are grouped into two major types (Leading and Lagging indicators). Understanding what type of Indicator being use will help fine-tune the traders mind to notice if the indicator is lagging or leading price. This helps the trader make a better trading strategy and also make a more accurate trading decisions. For example, a trader using the Stochastic indicator will need to take quick positions whenever the appropriate dojo stick occurs just before an intersection, this is due to the short duration of the indicator trend signals which leads price before reversing the at the next intersection.
Formation of Confluences
Using a one technical indicator as a single reference point when making trade decisions can be very dangerous especially when the indicator relays a fake signal to the trader. However, the inclusion of other technical analysis tools like chart patterns and dojo sticks can go a long way to reduce the risk involved in trading. Whenever any Technical analysis tool and a technical indicator relay similar signals at a particular point on a chart then a confluence is formed .A trader should consider the formation of confluences because trading with signals gotten from areas of confluence have a greater probability of resulting into profitable trades.
Trading Strategy
Every trader has a unique trading strategy that will determine a lot of things about his trading style and tools.
A trader who is prefers scalping(trading style that specializes in profiting off of small price changes and making a fast profit off reselling) would tend to prefer momentum and volatility Based Indicators which are classified under leading indicators. Unlike a trader which prefers to make profit after a longer period.
Q2.b. Explain confluence in cryptocurrency trading. Pick a cryptocurrency pair of your choice and analyze the crypto pair using a confluence of any technical indicator and other technical analysis tools. (Screenshot of your chart is required).
As explained in the previous section a confluence in cryptocurrency trading occurs whenever any Technical analysis tool and a technical indicator relay similar signals at a particular point on the market price chart of that crypto asset. For example, the screenshot shot below shows a STEEMBTC price market chart. Here you will see the Stochastic Oscillator and the hammer dojo stick form a confluence. At areas where the Stochastic Oscillator intersect and there was a hammer dojo candlestick formed there was a strong reversal from bearish to bullish trend and price rose from 0.0846 to 0.0863 BTC. A similar confluence is also formed at another point where an inverted hammer doji candlestick forms with an intersection in the Stochastic Oscillator. This led to a definite reversal from a bullish to a bearish trend. If you notice these hammer doji sticks do not occur at every intersection point.
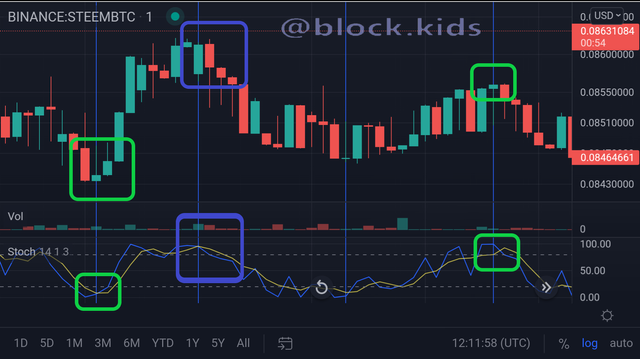
Source :screenshot
Q3.a. Explain how you can filter false signals from an indicator.
False signals are signals gotten from technical indicators which predict or indicate that price will act in a certain direction when in reality the price reacts in a very different way. Make trade decisions with these false signals may lead to huge losses during a trade. However, in order to filter these false signals from an indicator, you have to ensure that the indicator signal is in confluence with price action which is identified by other technical analysis tools.
Q3.b. Explain your understanding of divergences and how they can help in making a good trading decision.
Divergence in crypto trading occurs when the price of an asset is moving in the opposite direction to the signal direction as identified by the technical indicator. Divergences can be used to filter out false signals of the indicator and also used to detect prices reversals at an early stage which traders can capitalize on and make profits
When using Divergence to trade a trader has to be very careful not to use it as a singular reference point because there are limitations which makes divergences very unpredictable.
However, there are two major types of divergences namely;
Positive or bullish divergence
Negative or bearish divergence
Q3.c. Using relevant screenshots and an indicator of your choice, explain bullish and bearish divergences on any cryptocurrency pair.
Positive or bullish divergence.
Positive or bullish divergence occurs when the price of an asset is moving lower but a technical indicator is moving higher or showing bullish signals this type of divergences signals price could start moving higher in the near future, although the price reversal is not totally 100%. The screenshot below shows a bullish divergence in the Money Flow index indicator as price experiences a downward trend in the TRXBNB Pair
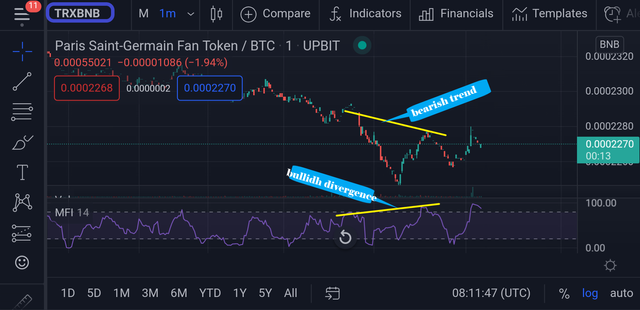 Source :screenshot
Negative or bearish divergence.
Negative or bearish divergence occurs when the price of an asset is moving higher but a technical indicator is moving lower or showing bearish signals this type of divergences signals price could start moving lower in the near future, although the price reversal is not totally 100%. The screenshot below shows a bearish divergence in the Money Flow index indicator as price experiences an upward trend in the TRXBNB pair
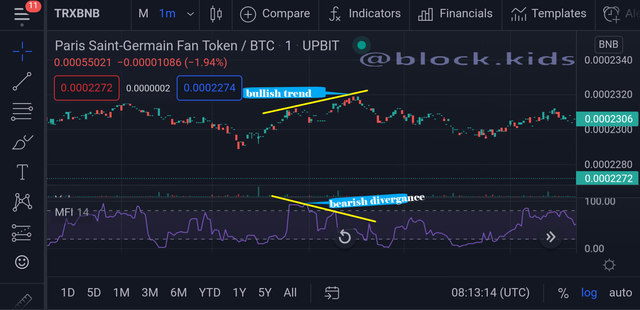 Source :screenshot
Conclusion
In this lecture exercise, more light has been thrown on the right way for technical analysts to use technical indicators in making good and profitable decisions.
There are many technical indicators in existence, however, they are all grouped under two categories which go a long way to determine how the trader uses these indicators to make trading decisions.
Leading and lagging Indicators are the two major categories of technical indicators, nevertheless, the trader stays very vigilant to identify scenarios like formation of confluences and Indicator divergence to secure a very profitable trade.
In conclusion, I will like to show gratitude to professor reminiscence01 and the whole cryptoacademy community for this opportunity to gain deeper knowledge of using technical indicators
Hello @block.kids , I’m glad you participated in the 4th week Season 4 of the Beginner’s class at the Steemit Crypto Academy. Your grades in this task are as follows:
Recommendation / Feedback:
Thank you for participating in this homework task.