Homework-Topic 2 || How To Read Candlestick Charts In Different Time Frame & Information about Buy-Sell(Support & Resistance) by @stream4u
Traders have been using the Candlestick Chart for trading for hundreds of years now. It is known that after 1800, a Japanese rice trader named Homa Munihesa was the first to invent the Candlestick Chart. Munihesa realized that although there is a relationship between the price of rice and the supply and demand, the market still moves with the emotions of the common man. The principles of the Candlestick Chart helped Munihesa to illustrate the rise and fall of rice prices over a period of time. Steve Nilson, a British gentleman, learned of the method from the Japanese and, after much research, promoted it under the name "Japanese Candlestick". The "Japanese Candlestick" has been popular around the world since the 1900s.
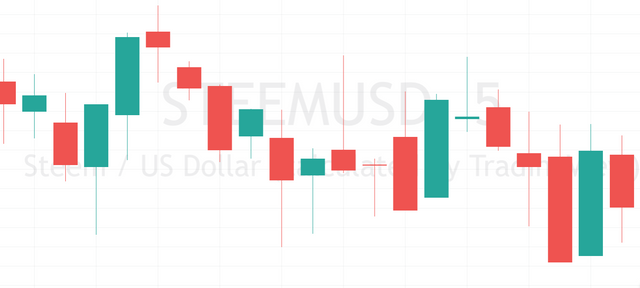
Bullish Candlestick (Positive Candlestick):
If the Closing Price is higher than the Opening Price of crypto, that Candlestick is called Bullish Candlestick. Bullish Candlestick colors are usually green.
Bearish Candlestick (Negative Candlestick)
If the Closing Price is less than the Opening Price of crypto, then that Candlestick is called Bearish Candlestick. Bearish Candlestick colors are usually red.
With these two types of "candlestick" in 1 day's trading, the buying and selling pressure is explained.

Shadow:
Any Candlestick has 2 parts, Real Body and Shadow. The long lines above and below the Real Body (Highest and Lowest Price) are known as Shadow. These Real Body and Shadow are sometimes very small, sometimes very large. Which reveals different trading situations in the market.
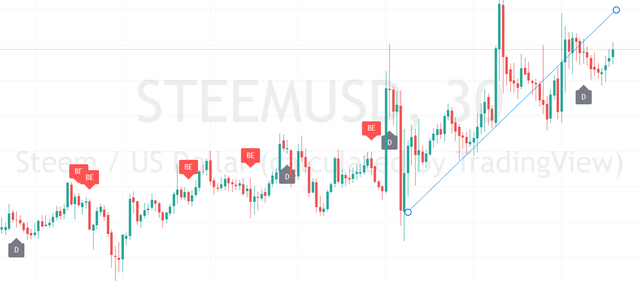
Short Term Traders(Day traders):
Short-term trading involves taking a position that can last from 5 minutes, 15 Minutes, and 30-45 Minutes. Short-term trading emphasizes mainly price action, rather than the long-term investment of an asset.
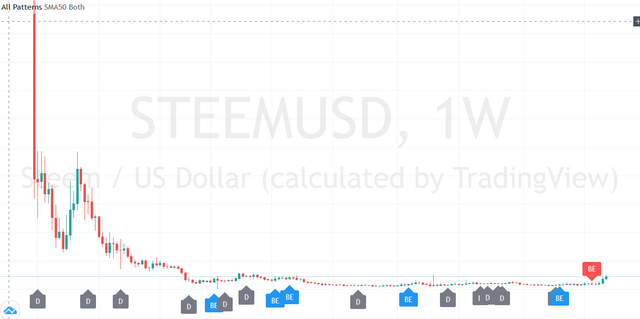
Long Term Traders(Holding Traders):
It is also known as Position trading. It's a trading style that involves a position that can last for an extended period of time like 1 Day or a Weekly candle. Long-term trading emphasizes mainly fundamental analysis. They mainly emphasize the future outlook of the market they are trading.
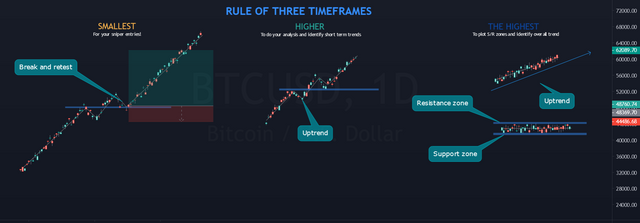
Time Frame:
There are various types of traders in the market. Some trades for the long term whereas some for the short term. In order to make money, the trader should know all the time frames. Time frames can range from minutes or hours to days or weeks, or even longer.
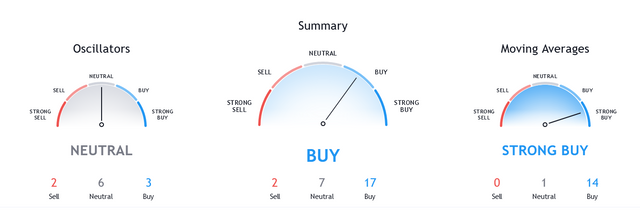
Support and Resistance:
Hitting 1 slab in the window does not break the window glass, but if 100 slashes of different shapes are hit, the chances of breaking the window glass are many times higher. Similarly, if one buys 100 shares of a coin, his purchase will have no effect on that currency. However, if 1000 investors buy that coin in different amounts, then the amount of purchase of 1000 investors compared to the purchase of 1 investor is helpful in increasing the value of the coin. This price increase can be in any area of support or resistance. If the share price increases with the increase in volume in the support area after a long or temporary downtrend, it should be understood that the coin has support in the previous/current new support line and this coin can be invested step by step. On the other hand, if the price of the coin crosses the resistance line with good volume, then it is understood that the demand for the coin is increasing in the market, and investors are attracted to invest in it.
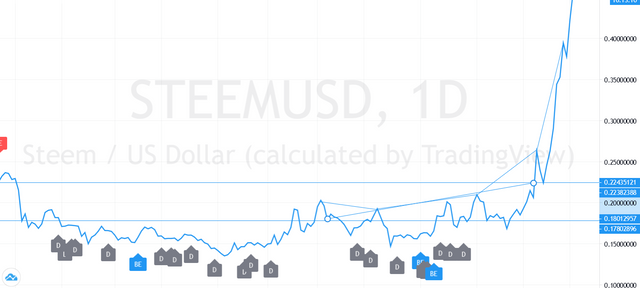
N.B: All screenshots are taken from tradingview(my personal account.)
Regards:
Cc:
@steemcurator01
@steemcurator02
https://twitter.com/boss7514/status/1361586150884843520