Crypto Trading by Identifying Support and Resistance - Steemit Crypto Academy |s6w3| - Homework Post for Professor @shemul21
It is amazing to be back on board, I have been a bit ill but we are grateful for good health. This is the week 3 of the lecture and the academy has been filled with surprises and great packages.
Today we will be going deep into support and resistance and how to use them effectively. without wasting much time, let's roll


In this question, I will be explaining the support and resistance zones which is generated by the reaction between the buyers and sellers of the asset or security creating certain limits that one or both parties cannot go beyond. let's start with the resistance zone the descend to the support zone
Resistance Zone
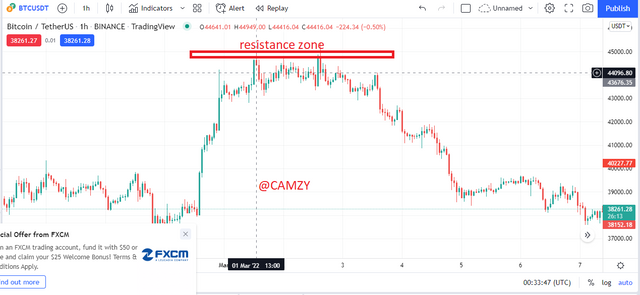
A Resistance zone refers to areas where price refused to go up in one direction and lodged there, offering a resistance that keeps the asset from shooting up. Resistances contain bulls and bears who balance out their interests in order to maintain equilibrium, which impacts how resistant the zone really is and what happens when price gets there. One side regards an upturn as a good thing, while the other sees it as a negative change. A resistence zone can be identified by looking for models that have failed to breakout from the repeated uptrend
Crypto trading becomes easy due to resistance zones, which allow traders to take profit and create new sell orders. Resistance zones have a psychological effect of rejecting the hiking price of an asset that creates excess supply that can force a change in the trend movement to a long term or short-term basis.
let's look at the image below
Support Zone
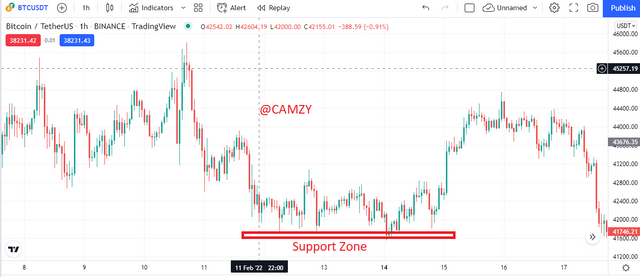
A support zone, refers to significant areas where price reacted and failed to close below. As it pertains to traders, these zones represent huge buy points that heavily impact your bottom line. When you see a significant decrease in those areas chances are prices will bounce back up. A strong support zone is characterized by the number of times price failed to cross and closed below those zones.
Similarly, the psychology that causes investors to buy an asset around a support zone can be explained. Investors will develop interest in an asset as its price starts to fall. This can be interpreted by observing an increase in volume near the support zone with no new orders above, which is known as the "buying climax". The demand then translates into an increasing asset price and a change in trend from bear to bull.
let's see the image below
There are majorly 3 types of support and resistance and I will be explaining them below
Horizontal Support and Resistance
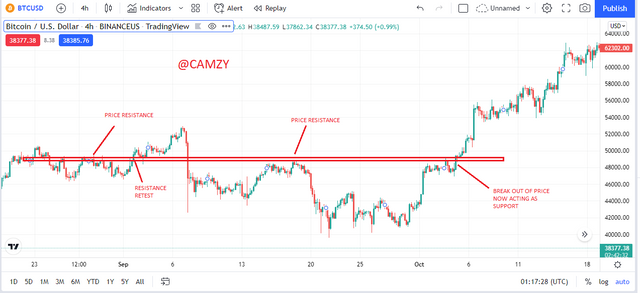
Horizontal support and resistance can be used to help analyze trends in the market. Ideally, when a resistance or support level is broken, price movement will either continue to move with the trend or break into a reversal. A resistance level can also serve as a support level when it is penetrated via a sell order and vice versa.
A breakout occurring at horizontal resistance indicates a possible trend continuation. When this breakout occurs, the resistance level is then considered the support level for prices long enough to form consistent higher highs and higher lows.

As we can see in the chart above, the were series of higher highs and higher lows and the price action acts as a support but the support was tested severally until it broke through the support and we can see the price action acting as the resistance
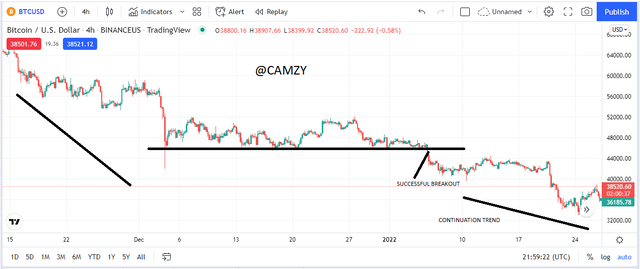
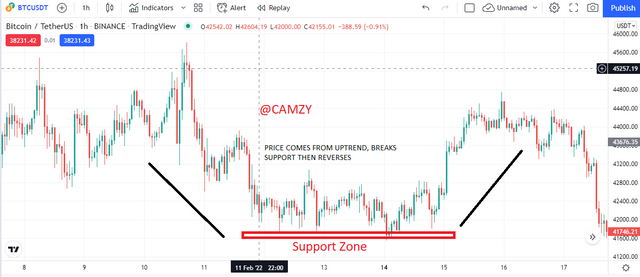
Likewise, a breakout occurring at horizontal support indicates a possible trend continuation. When this breakout occurs, the support level is then considered the resistance level for prices long enough to form consistent lower lows and lower highs.
From the chart above we can see that there were series of lower lows and lower highs and the price action acts as a resistance but the resistance was tested severally until it broke through the resistance and we can see the price action acting as a support.
Slope Resistance and Support
Slope support and resistance is also another type of resistance and support level. In an uptrend, it's comprised of a diagonal line in that trend created by traders' reactions. The slope level can be drawn in an downtrend as well; these lines demonstrate the sensitivity to different price points based on market participants' reactions.
A bullish trendline has to connect at least two higher low points to be considered an uptrend. This is known as a chart pattern of prices with diagonal support and an increase in the price of an asset, which indicates the presence of a bullish trend.
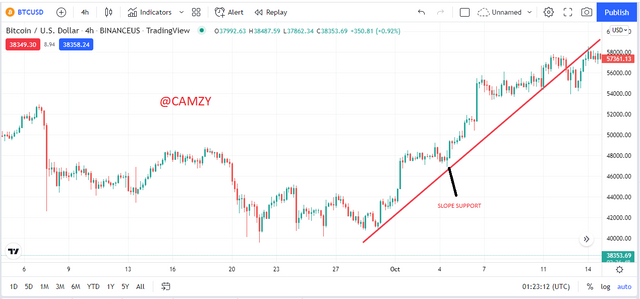
From the chart above, we can see the there are series of higher highs and higher lows and we draw our trendline to touch at least 3 points on the slope. showing that there is a slope support on the market.
Likewise, A bearish trendline has to connect at least two lower highs points to be considered a downtrend. This is known as a chart pattern of prices with diagonal resistance and a decrease in the price of an asset, which indicates the presence of a bearish trend.
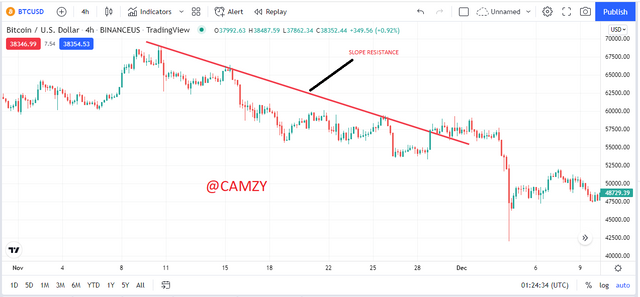
from the chart above, we can see that there are series of lower low and lower highs and we draw our trendline to touch at least 3 points on the slope. showing that there is a slope resistance on the market.
Dynamic Resistance and Support
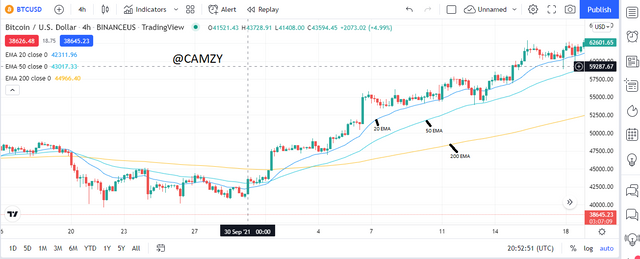
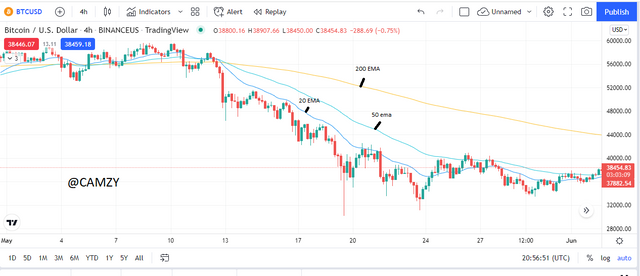
The dynamic resistance and support is an oscillating type of Support and Resistance that moves close to current prices. The Dynamic can be plotted with short or long moving averages and typically has many different times to create a graph for the support and resistance. Many traders who use Dynamic support and resistance go back in time, so that Trends or Demand/Supply is able to be identified more accurately.
Whenever prices bounce off a moving average, it is determined that the moving average is acting as a dynamic form of support or resistance. It all depends on your pattern of trading pattern, some traders make use of the 20 EMA, some make use of 50 EMA and some make use of the 200 EMA. where the 20 EMA is a comfort zone, the 50 EMA indicates a possible break and run in the same direction but as soon as we get to the critical zone which is the 200EMA there is hope for a possible reversal. this scenario is identical for both trends both uptrend and downtrend which serves as both support and resistance zone.
Breakouts occur when the price of a specified asset crosses and closes above a resistance or support. Breakouts are categorized into successful and false breakout.
Successful Breakouts
Support and resistance levels can be identified with a successful break out of the designated level. There are two types of breakouts, continuation breakouts and reversal break outs.
Continuation Breakouts
You can identify the continuation breakout with careful attention to momentum. If you break a support, for example, and it continues in a bearish direction because of the established trend, then success at that point is more likely. A continuation breakout can signify resistance as well because laboring under an established upward trend indicates prices may begin to stagnate or provide more subdued growth.
Reversal Breakouts
A reversal breakout is a successful breakout that occurs in the opposite direction of the previous trend and is characterized by the start of a new trends. Assuming the price is trading in a bearish trend, a break above the latest resistance point (generally seen as range) and continuation upwards may indicate that an uptrend has begun via a reversal breakout.
False Breakouts
A false breakout may happen when a movement of price above or below a resistance or support level fails and has been misinterpreted as meaning that there was no trade interest in that region. The trade was actually detected, but the direction of trade was then changed and cashed to maintain its previous movement.
Support and resistance are key principles in trading. Combining these principles with the RSI, volume and breakouts can afford new opportunities to find the best trades. The steps to successfully use support and resistance for trading:
You should first identify the support and resistance level of each indicator and then draw the corresponding S&R levels. First, zoom out of the chart and identify the support and resistance levels. They are either traditional, trend sensitivity or breakout.
The RSI should identify both overbought and oversold conditions, and bottoms are in when the RSI signals an oversold situation and the subsequent breakout is high volume and above 50 Rsi mark.
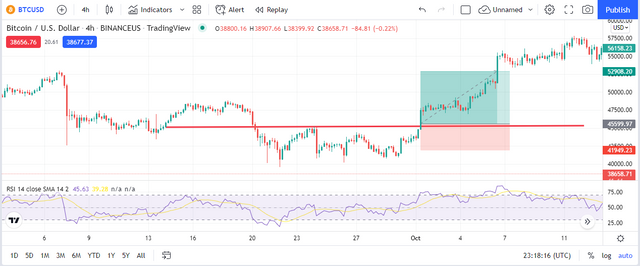
From the chart above, we can see the area of the support and resistance line drawn, we can also see the breakout carefully marked out. if we observe, the RSI was in an overbought region with the RSI mark above 50 and we place our stop loss and take profit at a 1:2 RRR.
Here I am required to carry out an actual trade based on the breakout strategy using the RSI as a conformation strategy.
in order to carry out an actual trade, there are certain precautions or guidelines that needs to be carried out.
- draw your resistance or support line on a zoomed chart
- watch for breakouts on the resistance or support line drawn
- watch the rsi level if it is above 50 mark for a buy or below 50 mark for a sell
- ensure that the volume is in correspondence to the rsi signal
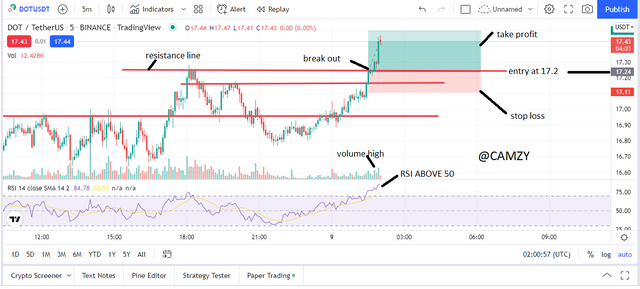
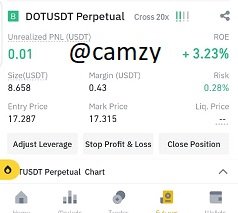
From the DOT/USDT chart above, we can see that the resistance line is carefully marked out and there was a breakout as indicated on the screenshot. I cross checked and observed that the volume was high with a corresponding RSI above the 50 mark.
Immediately, I went to my binance and executed my trade. watching my stop loss and take profit that was set to a 1:2 RRR
below are the details of the binance trade
I initiated the trade at 17.28 as we can see below
.jpeg)
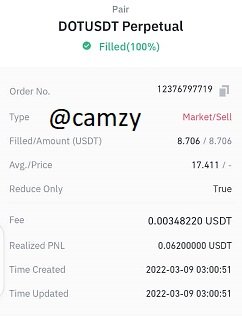
after a few seconds, we can see that there was an increase in the market
the rise continued to about 14% close to my take profit, and I noticed a bearish signal and immediately I closed the trade to take my profit at about 17.4
Like other technical tools, there are limitations to support and resistance. Support and resistance will break if they become weak. However, in some cases false breakout happens. False breakout is its main limitation.
False breakout of support refers to when the support gets broken but the price does not go lower than expected, instead the price goes above the support and continues going up.
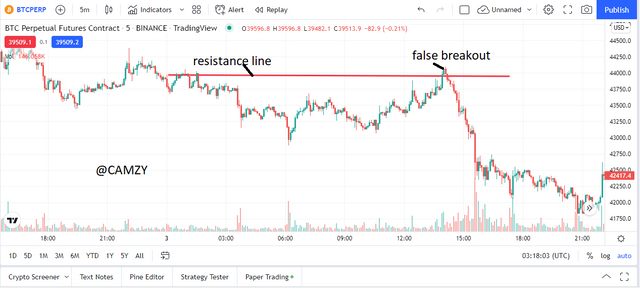
A false breakout occurs when the price breaks out of resistance but then doesn't continue increasing, instead coming back down and continuing the bear market.
Traders must be extremely careful when trading the breakout off support and resistance-- if they are not sure - they should wait. False breakouts could happen because of the activity of whales or institutions trying to induce traders into taking a position. Before opening a false breakout position, retail traders must make sure that they are waiting for sufficient buy and sell confirmations.
A trader needs to first identify the zone or area of support and resistance on the chart before attempting to trade in the market. When trading, it's important to take note of what causes movement and what prevents movement. If a market is trading within a band of support and resistance, the market tends to be less volatile.
Next, I explained on the three types of support and resistance. When the market is trending, support and resistance works well as sloping levels of them can often be seen. The 'Dynamic' type of support and resistance tends to work well in ranging markets. The 'Static' type should not be used if the market is trending.
Support and resistance play an important role in matching supply and demand, but traders should also use other tools to filter the false trends. thanks professor @shemul21 for this great insight.
ALL IMAGES REFERENCES : TRADINGVIEW