[CRYPTO TRADING STRATEGY WITH MEDIAN INDICATOR] - Steemit Crypto Academy- Homework post for Professor @abdu.navi03
Welcome to week 4 of the crypto academy and today we will be learning on the median indicator which was excellently delivered by @abdu.navi03 and I have read and understood perfectly and will render my answers to the questions below

An important technical analysis tool that traders can use in making good trading decisions is the median indicator, which uses a channel created from the median line and measures volatility.
The Median indicator is a trend based technical indicator that shows the directional bias of asset prices and corresponding volatility. It also indicates zones in which traders can make better investments.
With the ATR (average true range), investors are able to easily determine the volatility of stocks. The median line is plotted above and below the median line, which indicates when there are bullish or bearish trends in the market.
Bullish signals are indicated with a green cloud, while bearish signals are represented by a purple cloud.
The Median indicator is a trend based technical indicator that shows the directional bias of asset prices and corresponding volatility. It also indicates zones in which traders can make better investments.
The median indicator helps traders and investors identify the current trend by finding the median values that match peaks in trade.
When you first enter the quantitative market, it is important to understand indicators and indicators are gotten based on the mathematical models of price data points like the opening price, closing price, highs, or lows over a period. The indicator Median plots an upper and lower band above and below the median line.
for the calculation;
we have
Higher band = Median length + {2ATR}
Lower band = Median length - {2ATR}
where
median length = amount of data considered when calculating the median which has a default value of 3.
ATR = period considered when calculating the ATR of the median which has a default period of 14.
Multiplier = this has a default value of 2 which is multiplied by the ATR
Just as we know, the median = highest value + lowest value / 2
With the median indicator, when there is a drop in the index price, a purple cloud forms indicating that the market is bearish. When there is an increase in the index price, a green cloud appears to identify a bullish trend and indicates that it is time for entry.
let's look at how we can add the indicator to the chart
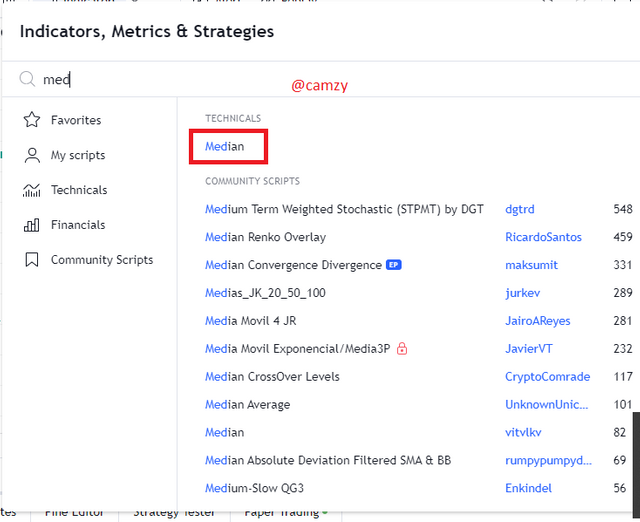
- First navigate to www.tradingview.com
- click on the indicators and search for the median as we can see below
You can configure the inputs by editing the median source, median length(period), ATR length, and ATR multiplier. You can also change the appearance to suit your desired style by changing the line style.
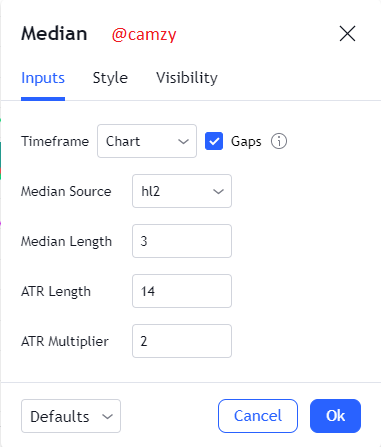
The above is the default settings which could always be adjusted based on individual trading system.
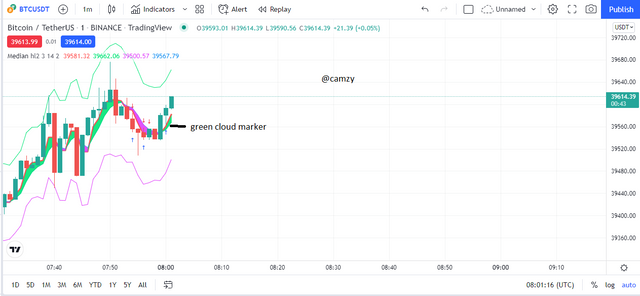
The median indicator predicts trends and can help traders identify buying and selling opportunities. The sentiment of buyers is bullish when the median is higher than the EMA, shown by a green color in the cloud cluster.
As prices cross the green cloud, it shows buying opportunities. It is generally best to invest when the price movement is crossing the green cloud.
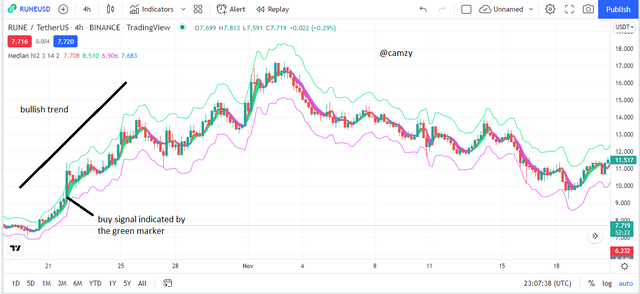
From the chart above we can see the bullish trend clearly indicated by the green marker of the median indicator, signaling that the buyers are in charge of the market.
The median line is the trend based indicator like the moving average. The difference between the median line and an EMA of the same lengths form a cloud that determines bullish or bearish trends. When the cloud is green, it means that the median line is above the EMA which signals an uptrend trend.
The median indicator predicts trends and can help traders identify buying and selling opportunities. The sentiment of sellers is bearish when the median is lower than the EMA, shown by a purple color in the cloud cluster.
As prices cross the purple cloud, it shows selling opportunities. It is generally best to invest when the price movement is crossing the purple cloud.
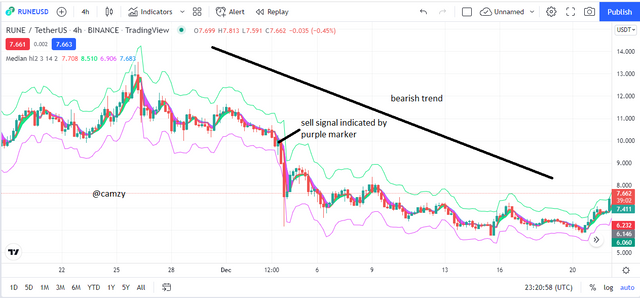
From the chart above we can see the bearish trend clearly indicated by the purple marker of the median indicator, signaling that the sellers are in charge of the market.
Fake signals can occur when indicators are not run on historical data such as the median indicator. Combining indicators such as combining the RSI with the median indicator can help alleviate some of this issue by weeding out potential false signals.
The RSI measures the relationship between the closing and the opening prices of an asset. If the RSI is over 70, it signals a bullish trend reversal. If it’s below 30, it’s bearish.
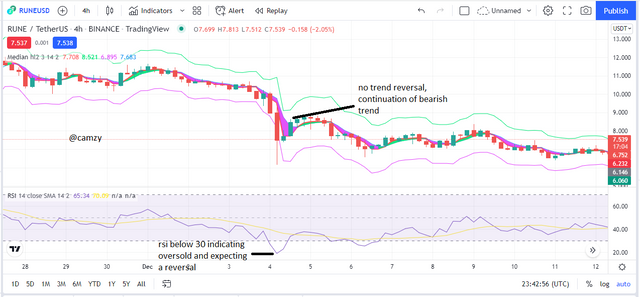
On the chart, we can identify signals of the RSI showing possible reversal by incating an oversold way below the 30 mark. However, looking at the median indicator, it is evident that sellers are still present in the market. As a result of this mismatch, you may avoid taking wrong decisions.
As required in this section, I will be opening two(2) demo trades a long(buy) and short (sell) sides on a market chart and for this question, I will be using the BTC/USDT chart on both sides.
LONG(BUY) ON BTC/USDT
From the BTC/USDT chart above, we can see that there was an initial downtrend and immediately, we can see that there is a green marker arising as indicated on the chart showing a good entry for a buy and immediately I placed my stop loss and take profit at a 1:2 RRR to maximize profit.
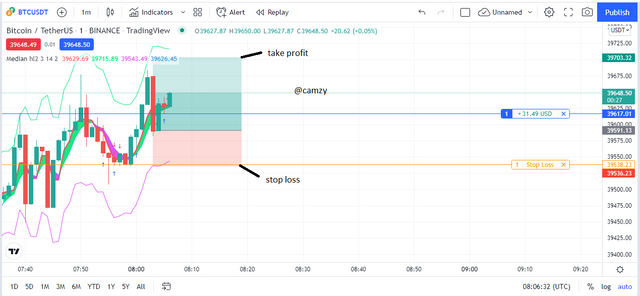
below is the profit executed from the trade as I patiently allowed the trade to approach the take profit zone.
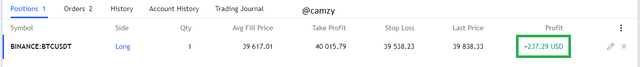
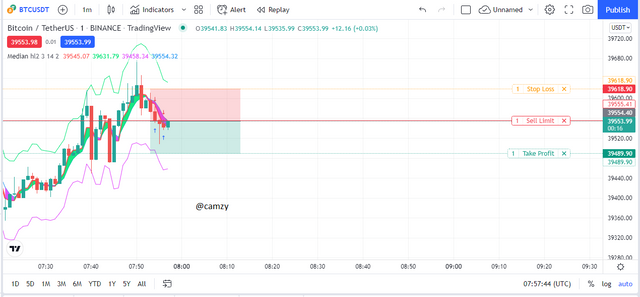
SHORT(SELL) ON BTC/USDT
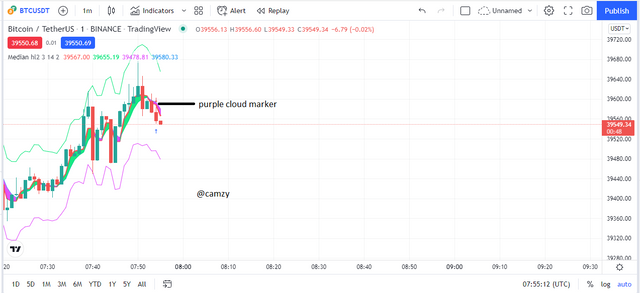
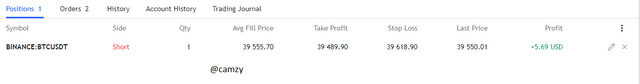
From the BTC/USDT chart above, we can see that there was an initial uptrend and immediately we can see that there is a purple marker formation arising as indicated on the chart showing a good entry for a sell and immediately I placed my stop loss and take profit at a 1:1 RRR to maximize profit.
below is the result of the demo trade
CONCLUSION
In this study, we have discussed the median indicator and how you can use it to signal change from a bullish trend to a bearish trend. The indicator is based on the trend and changes from green to purple when there is a shift in trend.
The Median indicator works by calculating the median values of relevant peak swing points (highs and lows) within a specified interval and compares it to an EMA of the same period. The deviation between these values is represented with a colored cloud depending on the higher line value, helping investors and traders identify possible buying or selling opportunities.
Indicators are not always accurate, but they can provide reliable signals when combined with other technical analysis tools.
BEST REGARD
@abdu.navi03
IMAGE REFERENCE: TRADINGVIEW