Crypto Trading Strategy with Triangular Moving Average (TRIMA) - Crypto Academy |S6W4| - Homework Post for Professor @fredquantum
Hello guys, this is week 4 of the academy with awesome learning and this week we are talking about the Triangular Moving Average (TRIMA). Let's get to work.


Technical indicators are tools in technical analysis used to predict the direction of an asset and its strength. Other gauges may have strengths and weaknesses depending on their type.
The Moving Average indicator is one of the most commonly used indicators to determine the trend of an asset. But, it’s a lagging indicator because it only uses past data when calculating and so it can’t give you a real idea of what is happening now. There are types of moving averages, like Weighted Moving Averages, or Exponential Moving Averages, but the one I'll be talking about here is Triangular Moving Average (TRIMA).
A Triangular Moving Average (TRIMA) is a type of moving average that factors in past market data to calculate the trend, making it more accurate than the Simple Moving Average. It uses the closing price two times to put less emphasis on the present and give more weight to the past.
An Triangular Moving Average indicator creates a smoother line than simple moving averages, and it does not react to high volatilities.
It's quite easy to set up the indicator in few steps
- visit www.tradingview.com
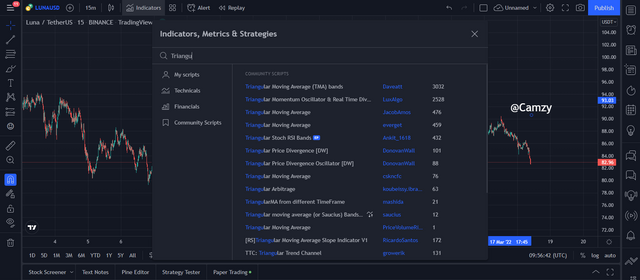
- click on chart and click on the indicators and search for the triangular moving average as seen below
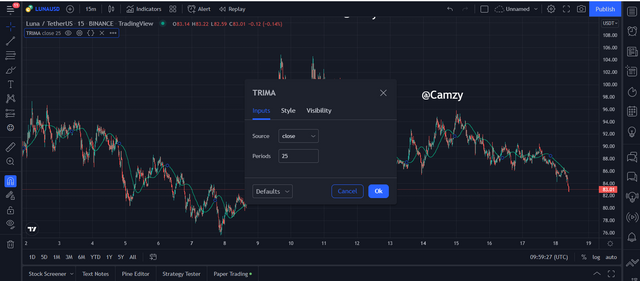
- We can also adjust the input, change the style and play around with the visibility
Let's move straight to the calculations of the TRIMA
When calculating the TRIMA, you first calculate the SMA and take the average of that, so we will be starting with the formula for SMA
SMA = {P1 + P2 + P3 +.. + Pn]/n.
where P = price and P1- P3 = price of asset at different periods
pn= last price of the asset
n = number of periods
so therefore for TRIMA just as I explained above we will take the SMA to calculate the TRIMA
TRIMA = {SMA1 + SMA2 + SMA3 + .. + SMAn]/n.
the above formula is used to calculate the trima at different periods
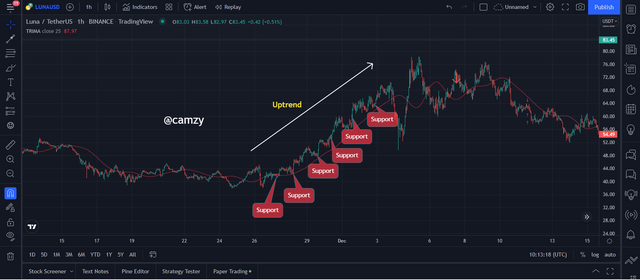
UPTREND
You can use indicators to identify trends in the market. However, sensitive settings can make it difficult to detect certain trends. You can use indicators with a longer interval for long-term trend identification and you can use indicators with a shorter interval for short-term trend detection.
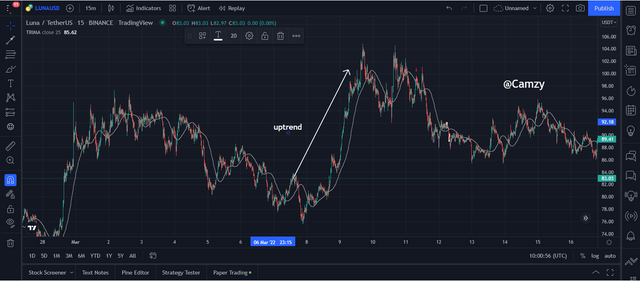
In a TRIMA indicator, assets trade in an uptrend when prices are trading above the TRIMA indicator. The price cannot move above the TRIMA line without first trading below it. Example of a bullish trend’s screenshot below.
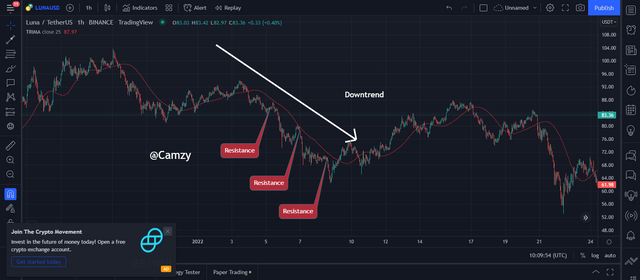
DOWNTREND
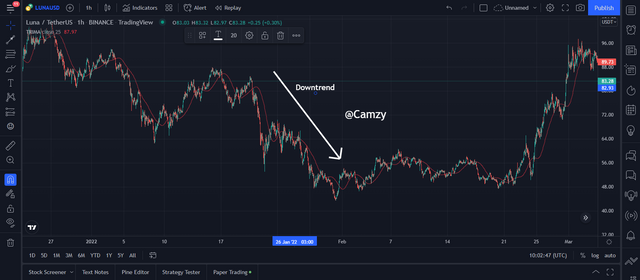
In a downtrend, the price of an asset will continue to trade below the TRIMA indicator. This means that the TRIMA line will be above the price of an asset. look at the screenshot below
In economic trading, a moving average can act as dynamic support. TRImoving Average (TRIMA) is a specific kind of moving average that indicate when the price is to bounce back from direction to the opposite immediately in touch with it.
As in the screenshot given, we see that there is a series of higher highs and higher lows on the chart and that TRIMA line acts as a dynamically support here. When a retracement in an uptrend turns around at the touch of a TRIMA line, it means that line serves as dynamic support in this case.
In this scenario, when a TRIMA line is touched the opposite of elastic supply will resist, meaning the price will bounce back to the downside. showing that the TRIMA is acting as a resistance to the price action as seen below
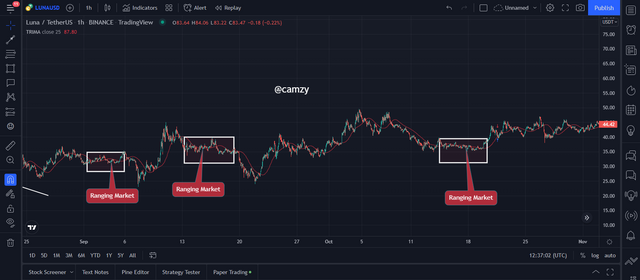
The TRIMA indicator behaves differently in a consolidating market. When the price is going up and down, but hovering around a particular point, the TRIMA line is within that price range. look at the screenshot below
The TRIMA indicator does not always respond quickly to major changes on the market. If you were just using this indicator as part of your trading strategy, price would have moved by the time you entered your order to buy or sell. You should use a TRIMA indicator as well as at least one other indicator to trade successfully.
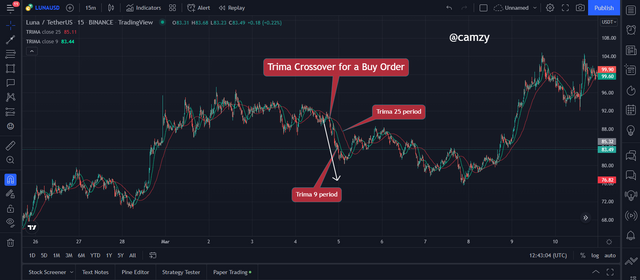
The first TRIMA indicator I have plotted has a shorter time horizon of 9 periods, and the second has a longer time horizon of 25 periods. The best way to interpret this is that they are based on trends over 15mins as the period length.
When a shorter period crosses above the longer period and signals an uptrend, traders can take advantage of this crossing to take a buy order.
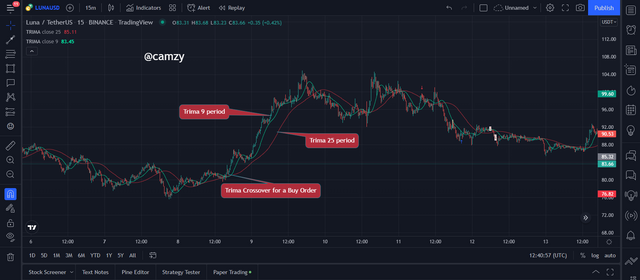
When a shorter period crosses below the longer period and signals a downtrend, traders can take advantage of this crossing to take a sell order.
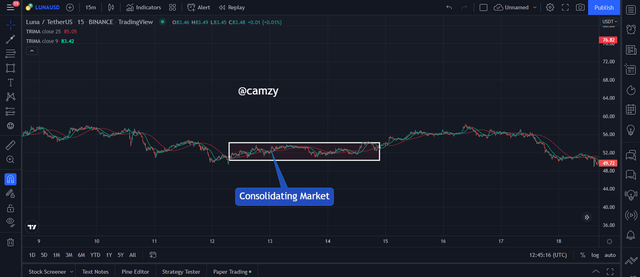
For a consolidating or ranging market as we can see below the TRIMA doesn't give a clear buy or sell signal and it advisable for traders to hold on until there is a clear signal.
In this task I meant to give the conditions for a trade reversal using the TRIMA and the RSI on a chart analysis. Lets's start with the bullish reversal condition then we move to the bearish reversal.
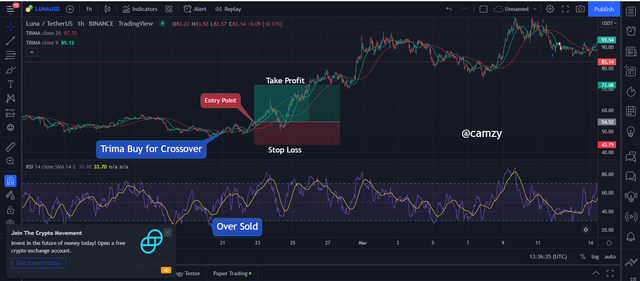
CONDITIONS FOR BULLISH REVERSAL
In order to buy bullish reversal, you need to see price significantly go down before getting signals for a change.
Add two periods to your chart, one short and the other long. You could use 9, 25, or any other periods you prefer.
The RSI indicator must be in the oversold region for the downward pressure on the share prices to be reduced.
RSI crossed below the lower line, which means it is now oversold. Wait for RSI to cross back above the lower line before you buy.
Place a buy after seeing any bullish indicator.
It is vital to use stop loss order for risk management. They should be placed below the previous low and the risk to reward ratio should be 1:1 for inexperienced traders.
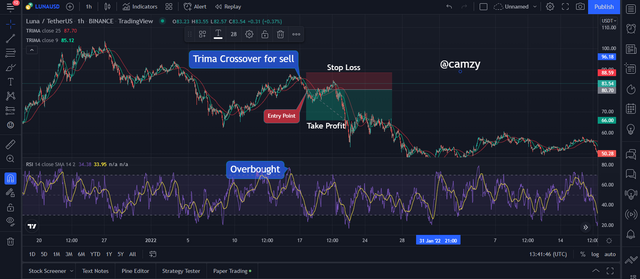
CONDITIONS FOR BEARISH REVERSAL
In order to sell bearish reversal, you need to see price significantly go up before getting signals for a change.
Add two periods to your chart, one short and the other long. You could use 9, 25, or any other periods you prefer.
The RSI indicator must be in the overbought region for the upward pressure on the share prices to be increased.
RSI crossed above the higher line, which means it is now overbought. Wait for RSI to cross back below the higher line before you sell.
Place a sell after seeing any bearish indicator.
It is vital to use stop loss order for risk management. They should be placed above the previous high and the risk to reward ratio should be 1:1 for inexperienced traders.
TRIMA AND MACD
The MACD is an indicator that can be used to provide information about price direction. It's made up of two EMA; the first EMA records a fast period, and the second EMA records a slow period. The crossover of the fast period EMA crossing above and below its slow period counterpart is a trend reversal signal. For example, you can add a slow period and fast period EMA of the same length as TRIMA (a momentum-based indicator). The crossing over on the MACD will indicate whether or not this trend applies to TRIMA.
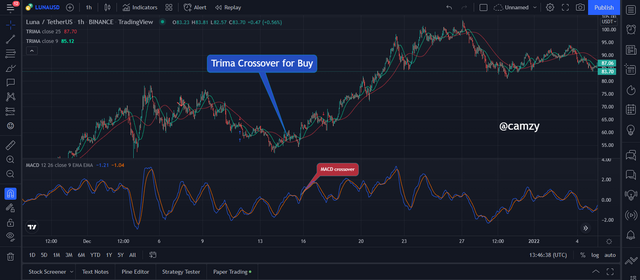
From the chart, the crossover of slow and fast EMA show that we have a bullish trend reversal. When the indicators cross again, we will see buy position opening soon.
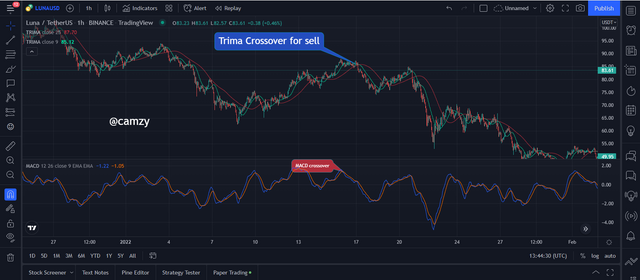
For a bearish reversal, there was a crossover of the slow period EMA below the fast period EMA which is a bearish reversal signal. There was also a crossover of the slow period TRIMA below the corresponding fast periods signals that there will be a bearish reversal.
DEMO TRADE
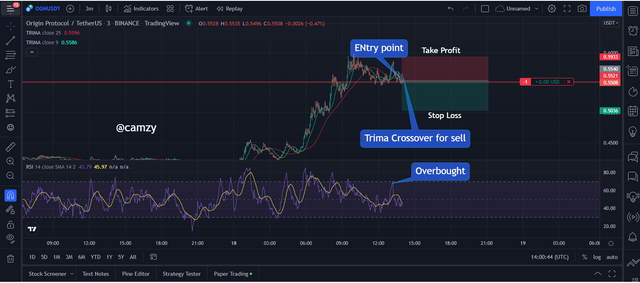
From the chart above we can see the price of the OGN/USDT on a rise until it is gets to a certain high which is on the bullish trend, on the RSI we see the indicator on an overbought region as we expect a bearish reversal. I watched until the the indicator reversed and descended downwards signifying a sell entry, also on the TRIMA indicator we see the short TRIMA going below the long TRIMA also indicating a sell entry. At this point we place our stop loss and the take profit at a 1:1 RRR
The above details are the details of the sell trade.
REAL TRADE
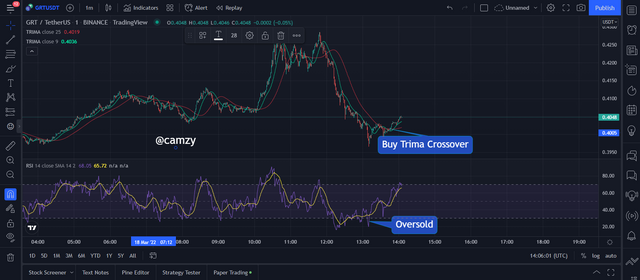
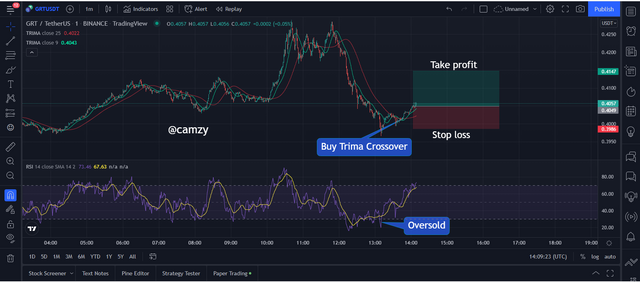
From the chart above we can see the price of the GRT/USDT on a fall until it is gets to a certain low which is on the bearish trend, on the RSI we see the indicator on an oversold region as we expect a bullish reversal. I watched until the the indicator reversed and ascended upwards signifying a buy entry, also on the TRIMA indicator we see the short TRIMA going above the long TRIMA also indicating a buy entry. At this point we place our stop loss and the take profit at a 1:1 RRR
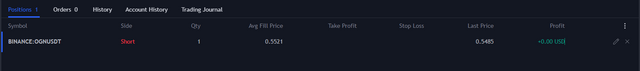
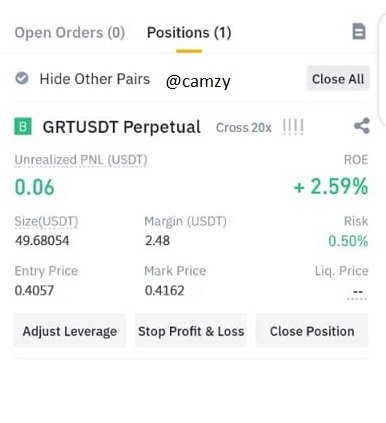
below is the image of my verified binance and the trade entered.

Here are the details of my trade
ADVANTAGES
The TRIMA indicator is a way of determining trends for an asset over a period of time.
Crossing over the TRIMA indicator can be an good indication of buy and sell entry as it is easy to read
The triangle moving average does not overreact to the high volatility of weak news and does not underreact to the high volatility of powerful news.
This trend is very clear and clean
DISADVANTAGES
- The TRIMA indicator lags crypto trading signals and traders may miss the beginning of an asset’s price movements.
I have summarized TRIMA indicator in my own words and I have taken screenshots to show how this indicator works on the trading view website. I have also explained how to use TRIMA to identify an uptrend and a downtrend.
Additionally, I found buy and sell signals by an indicator called TRIMA. And by combining the TRIMA indicator with RSI, I was able to buy and sell stocks on a demo account as well as Real account.
Best Regards
@fredquantum