Crypto Trading Using Trix Indicator] - Crypto Academy /S6W3-Homework Post for professor @kouba01


The Trix indicator uses three exponentially moving averages to establish trends and generate accurate predictions. These exponentially moving averages smooth the indicator, providing a more stable prediction.
Exponential moving averages react to price quicker, which can plague traders with sharp fluctuations in the market. Using 3 exponential indicators, traders can filter these unnecessary price fluctuations and creates accurate trading signals.
Unnecessary price fluctuations are eliminated with the Trix Indicator. The indicator reveals future market movements, so technical analysis can be used for better entry points.
Learn how the Trix indicator works
The Trix indicator helps traders identify the market trend by drawing a dynamic line on a chart. The EMA is a trend-based indicator that can identify trends more quickly than the simple moving average.
The EMA was not effective in filtering out unnecessary market noise, leading to the trader falling for price manipulations.
The Trix indicator was developed to resolve some of the issues that are present in the Exponential Moving Average. Specifically, it filters the noise and unnecessary price fluctuations that make it harder to develop a chart.
The Trix indicator helps you trade by have horizontal movement above or below the zero line. Crosses above the zero line signal a bullish movement, and crosses below trigger a bearish movement. It signals price reversals when divergence occurs between price and the Trix indicator.
Technical indicators are products of a mathematical model that is generated from past data points, such as the current price. In this section we looked at the example of our fundamental indicator, the Trix. The Trix is calculated through 3 exponential moving averages.
The default setting for the indicator Trix is 14 periods of supply and demand data. However, this can be modified as needed by traders.
2EMA = EMA [1st EMA, N, p]
3EMA = EMA [2nd EMA, N, p]
Trix=(3EMA[p] - 3EMA[p - 1]) / 3EMA[p- 1]
where 3EMA = triple EMA and P = current price , n= period
let's look at the image below
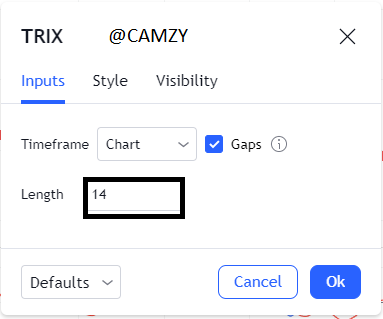
Do not use a Trix indicator if you do not set the period properly. It is best to try different periods and choose one applicable to your trading style.
In the Trix indicator, there is a settings icon that you can click on to modify the settings of the indicator. You then configure it for your own investing style by changing the period as we can see it marked out below.
The EMA is a trend-following indicator that can be easily seen with a glance of the chart. It helps to determine the current market trend by looking at the movement of price from above and below the EMA.
The Trix indicator is a good indicator to predict the trend by analyzing the oscillation of the Trix indicator above and below the zero line. When price crosses above the zero line, it signals a trend change from bearish to bullish. At this point, a trader can look for a buy entry in the market. An example can be seen on GRT/USDT chart below.
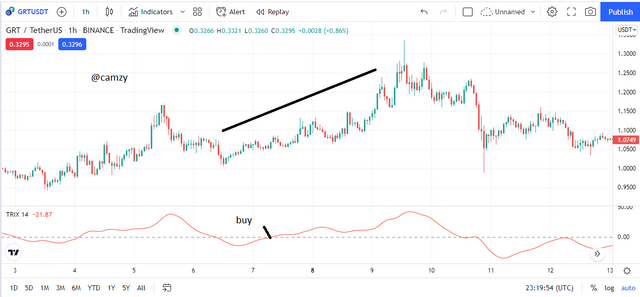
An entry position for a buy can be the the Trix indicator goes on top of zero line, as it did in the sample chart above.
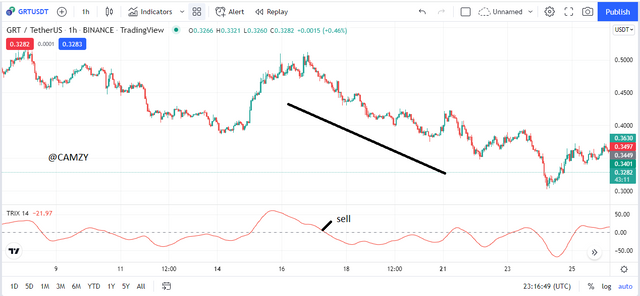
When the TRIx indicator goes below the zero line, it becomes a selling interest. When the Trix indicator crosses below the zero line, it indicates a trend in change. The trader can then look for a sell entry to take their chance. look at the GRT/USDT chart below.
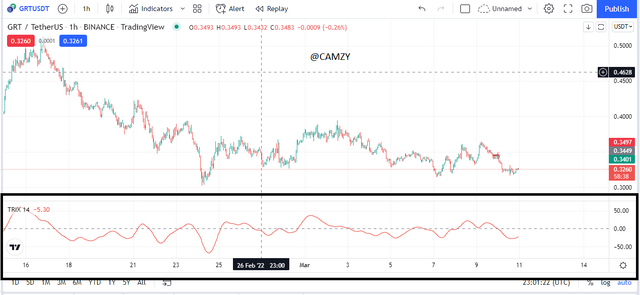
The Trix indicator filters current price movements as well as noise and insignificant price movements. This makes it a reliable indicator to follow when making trading decisions in the market.
and also helps the traders to determine the ranging market as we can see below on the chart along side with the immediate price change.
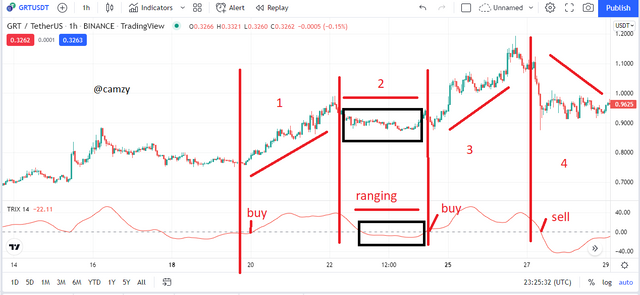
In the first section we can see that the trix indicator, entered the signal for the buy a little bit late by crossing over the zero line in which the price has already begun the trend.
In the second section we can see a ranging market which was also in accordance indicated by the trix indicator showing a slow downward movement on the chart.
In the 3rd section we can see that the trix indicator entered quite early for the buy signal before the price action which would help buyers make a good entry in the market.
Likewise on the 4th section, we can see that the trix also entered into the market late lagging behind the price action. so we could conclude that the trix although it could give an early signal, it could also lag behind the price action.
One signal is from the EMA on Trix and will signal when the price moves to an extreme level on the indicator window. We can do this by using 9 period EMA of the Trix indicator. With this, we can obtain a signal similar to that of MACD.
If the MACD crosses the Trix, we will consider taking a long position. Similarly, if the Trix crosses below the previous day’s moving average, we will take a short position.
Using a 9-period signal line and 15 period signal on the trix while on MACD over 12,26, and 9 periods, we can see the difference in the two indicators. Both will have lines oscillating above and below the zero line.
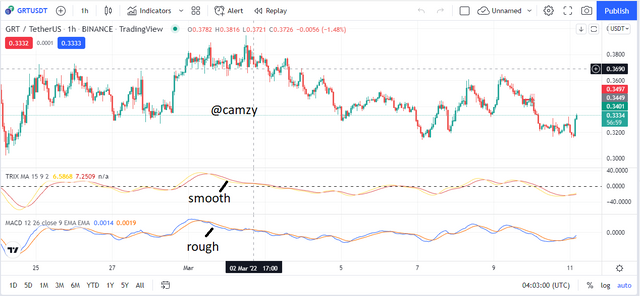
From the chart, we can see that Trix has a higher success rate of predicting a well filtered price than MACD. MACD has an erratic or rough signal line which is an indication that it's catching movements in noise rather than actual fluctuations.
The MACD tends to react faster than the EMA. This is because it considers more of the price changes and disregards incidental movement in price, as opposed to the EMA which smoothens out all randomness. The MACD tends to cross over 0 first, as it counts for more algorithmic changes than the Trix indicator does.
Zero line of the Trix indicator is a strong factor in generating signal information. When the Trix signal line crosses above zero, it signals a change from bearish to bullish trend
When combined with other technical analysis tools, the Trix zero cutoff offers strong signals. In addition to this, we can use divergence to spot reversal points in the market. Divergence is a sign that certain trends are weakening and the price may reverse soon.
Let's look at the NEO/USDT chart below
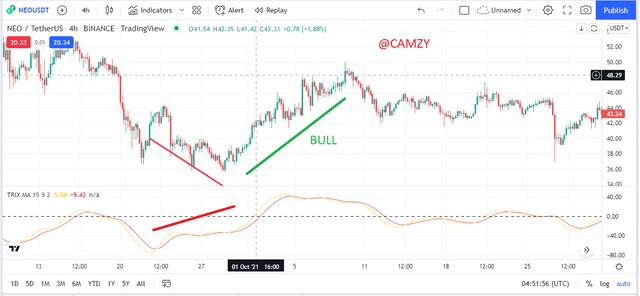
The Trix indicator has a bullish divergence at the start of a downtrend. This means that the bearish trend is coming to an end and may go in the opposite direction soon. A few days later, we see that this trend reversal was confirmed by the Trix crossing above zero line.
Technical indicators can be unreliable, and can give false signals. Combining the Trix indicator with other technical instruments has been shown to increase these indicators’ effectiveness.
The Trix indicator can help traders identify trends, but it is not necessarily conclusive. Combining the Trix with other indicators like the moving average crossing 20 and 50 SMA can help traders identify worthy trading opportunities.
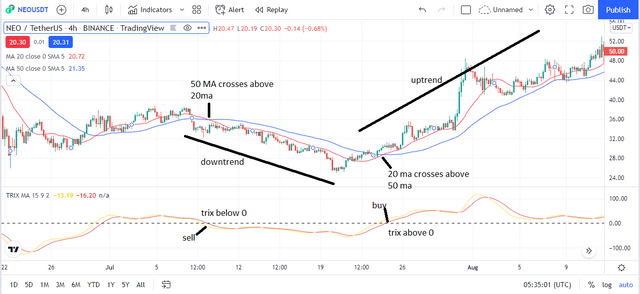
from the NEO/USDT chart above, we can see that the buying and selling signals were confirmed by both the trix and the SMAs, where when the trix crosses above zero(0) it indicates a buy signal and when it crosses below zero (0) it indicates a sell signal, This was also confirmed by the 2 SMA of 20 and 50 where when the long moving average of 50 crosses above the short moving average it represents a sell signal and likewise when the short moving average crosses above the long moving average, it indicates a buy signal.
The combination of the Trix indicator and the moving average strategy filter false trade signals, by seeing if the required conditions are met. If anything disagrees with a requirement, there's a chance it is a false trade signal.
the Trix indicator more closely follows price changes and applies a smoothened function, which reduces the reactant effect. This balances buyer/seller market pressure and ensures getting in on trade opportunities early.
The Trix shows price changes and trends with either an upward or downward indicator line, which is simple to read.
It is important for traders and investors to be able to identify price reversals based on a divergence between the price movement and the Trix indicator line. This will help them know where the next strong opportunity may be which is a great advantage.
In an upward or downward trending market, the Trix indicator is useful. In an unsteady market, it often causes misinterpreted trade signals.
Trix lag behind price. This is because it uses past data about price to make its prediction. Trading after this has already moved can cause a reversal and lead traders to holding on for too long.
The indicator is best used with other indicators and tools to set clear trading strategies, which is a con as it cannot stand alone
In conclusion, The indicators ability to identify trends depends on the trader's ability to identify trends and use multiple indications to build confluence.
It is good to Keep an eye on the market trends with Trix, a momentum-based technical indicator that filters out noise and price fluctuations. The Trix indicator can help traders identify buy/sell signals in the market.
Though the Trix indicator has been found to give mid-strong signaling, it can still give false signals, so it is best to use it in conjunction with other signals for more accuracy.
Best Regards
@kouba01
Image references tradingview