[Crypto Trading with Price Action] - Crypto Academy / S6W2- Homework Post for @reminiscence01
Greetings steemians, it had been a stressful week but I still found time to write this homework post because I really love the lecture and how it was excellently delivered. without wasting time, I will be answering the questions from the lecture

The three main methods traders use to analyze and predict price direction are fundamental analysis, sentimental analysis, and technical analysis. As a matter of fact, many traders are beginning to make use of technical analysis more than they have in the past.
Some traders prefer technical analysis as they can easily predict the direction of a currency via the price chart. This contrasts with fundamental and sentimental analysis, which have inefficiencies when it comes to getting needed information. One problem is that most of the information are not accessible enough for use, but another hurdle seems to be that people still need time to understand it might not be for them.
Price Action, the movement of price shown on the chart, is important to traders because it helps them understand how emotions and psychology are trading in the present and what will happen in the future. Price action traders only predict with the past's historical graphs/charts, which show their reading of the graph.
Price action makes retail traders to be able to follow the direction of price. Hobbyist can predict the direction of price and make trades in long-term, but it requires a signficant amount of skill on their end- such as major usage of technical analysis tools.
We'll look at how to use pricing action to help us while our trading. When we see a trend, the best strategy is to ride it; when we see the market depart from that trend, it's best to exit.
Price Action is powerful because it helps traders determine the psychology of buyers and sellers. A trader can use price action to opt in or out of a position, considering what the other party is doing. New article: Price Action in Trading and How It Can Help
Unlike fundamental analysis that requires you to rely on price fluctuation, price action allows you to use identifying points of entry and exit in the market. Price action parameters allow you to make the final decision with more detailed information on a given asset.
This is an important aspect of price action that can help traders filter noise and false signals in the market. When traders use technical indicators on a chart, they confirm the signals by applying price action. This helps to show if the signals are perfect or not, plus weeds out all the noise on your chart. Traders can often switch to higher timeframes to see if they have more information.
Cryptocurrency traders should always combine technical analysis with price action. One tool is not enough; use multiple tools to predict the prices movements with accuracy. Confusing prices movements can be predicted when using a variety of trading tools.
One advice I offer for anyone wanting to trade cryptocurrency is to combine other technical analysis tools with price action. Our success rate will increase when we use different analytics as well as pay attention to a very brief formation of price action. For example, it\'s OK to keep limping in when the risk/reward ratio favors us, that is, the amount of possible profit is greater than our stake.
I’m going to be discussing Japanese candlestick charts, (or candles) their importance in technical analysis, and let you know what I think is the best way of analyzing crypto trading via candlestick chart patterns.
In order to see the price's movement, traders will look at the chart. A candle stick shows how buyers and sellers interact in the market- when buyers are in control, prices increase; when sellers are in control, prices decline. The graph can show both increments and decrements depending on what type of chart is used by traders.
The line chart is a simple type of chart and is used most in trading because candlestick charts provide crucial information, unlike other chart types. Candlestick charts give more detail, including the open and closing prices, as well as the highs, lows and average (or close) of an asset’s daily price for each day.
A dynamic strategy such as using candlestick patterns can greatly increase your chances of success in cryptomarkets. With tradingview's set default, a candle will be called bullish if the closing price is higher than open, and bearish if lower.
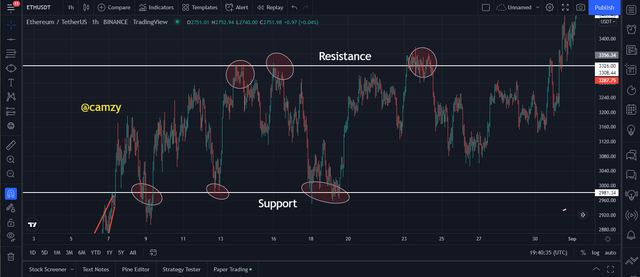
Along with volume and momentum, some traders use the candlestick pattern for indications of support & resistance or overextended trends. While as others may utilize it as an opportunity to participate in a trade by entering before, during or after the occurrence.
Forces of supply and demand that determine the direction of price are also shown by Japanese candlestick. With support and resistance levels, we predict falls or rises in price.
In cryptocurrency, candlestick charts can be used for determining trading potential and momentum. However, candle charts often don't show trading trends in higher time frames and to get a better picture of the overall trend, line charts and candlesticks are often paired together.
Crypto traders are finally taking advantage of Multi-Timeframes Trading. Utilizing all timeframes helps maximize profits by identifying trends and patterns early.
According to some traders, higher timeframes are used to determine the overall price trend, or whether a trend is bullish or bearish. Lower timeframes are where traders place entry and exit positions to make larger profits from intraday patterns that might not be so evident on higher timeframes.
Traders modify their timeframes depending on their trading style or strategy. The timeframe one uses determines whether they will look at the trend of an asset as a whole, and entry and exit points, or if they are looking to make profits on small price changes. Swing traders look at monthly and weekly timeframes to determine the overall trend while intraday traders use daily and four hour timeframes, soon joining the 5-minute group.
In the world of crypto trading, fluctuating market prices mean that waiting for accurate entries and exits is key. For those who don't have expertise in technical analysis, it's a good idea to focus on confirming overall trends from higher timeframes and then refine by analyzing short-term fluctuations on lower timeframes as required.
IMPORTANCE OF MULTI TIME FRAME
One very important feature of crypto traders is to have the ability to analyze the higher time frames. By analyzing the time, traders will be more capable of determining the overall trend of current cryptocurrency movements.
Price action trading can be noisy. But with filtering, traders can filter out the noise and make better judgment about the price direction. Higher timeframes filter out noise on lower timeframes
The use of multi-timeframes allows traders to reduce the amount of risk taken, as the the trader can analyze market direction on a high timeframe and take an entry on a lower timeframe.
A multi-timeframe analysis will help estimate market sentiment. For instance, if we see a bearish pattern on a higher timeframe, but are unsure how the trend will affect an asset on the shorter time frames, seeing that same pattern on all the timeframes would suggest action to take by selling with confidence.
Here we will be analyzing the ETH/USDT chart to be on different time frames let's start with a 4 hour time frame
4 HOURS CHART
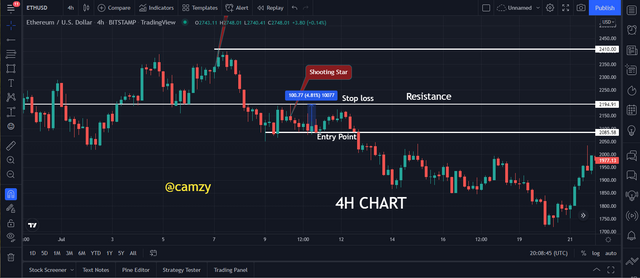
From the chart above, we can see that the resistance line was carefully marked, we can see the shooting star rightly marked out too. the price forms a double top with the price going below the neck line it signifies that the there is a bearish reversal and an entry can be taken as soon
1 HOUR CHART
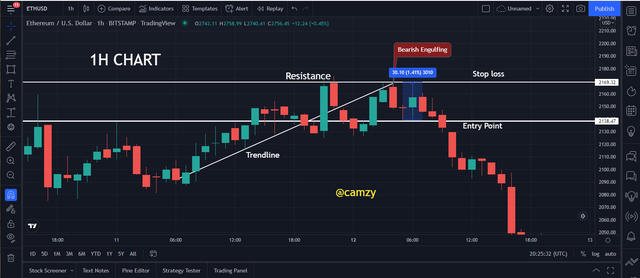
For the 1 hour chart above we can see the price started ascending until it got to a resistance and there is a retracement and it bounces upward again to retest the resistance line where we can see the formed engulfing candle and the price retraces, as soon as it crosses the neckline created by the resistance retest we place the trade setting our stop loss and take profit at 1:1 RRR
15mins Chart
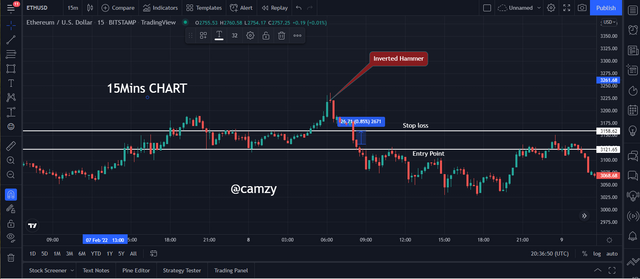
On the 15 mins chart, we can see the price on an ascending bullish sequence until it gets to a point where we see the inverted hammer signifying a bearish reversal. the price falls below the support and we make our entry as we can see in the chart above.
For this task, I will be analyzing the BTC/USDT chart on different time frame in order to execute, let's start on a 4hour time frame
4 hours chart
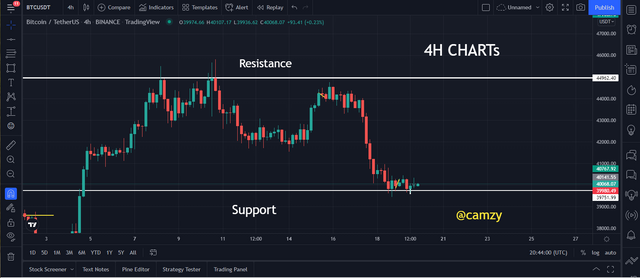
From the chart above we can see the resistance of an asset excellently marked out, we see a decline in the price of an asset creating a bullish trend until it reaches a support and bounces upward
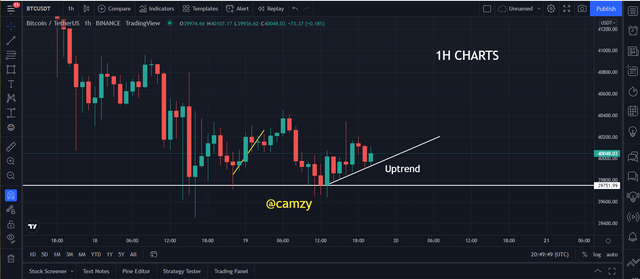
On the 1 hour chart, after bouncing on the support we can see the bullish trend on the rise and we are still taking note. Let's move over to the 15mins chart.
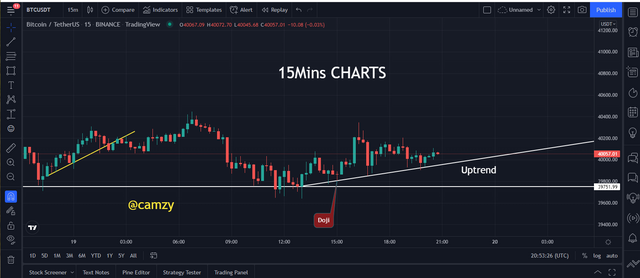
On the 15mins chart we can see there are series of higher highs and higher lows and there is an appearance of the doji and we draw an up trend line, let's move over to the 5mins time frame.
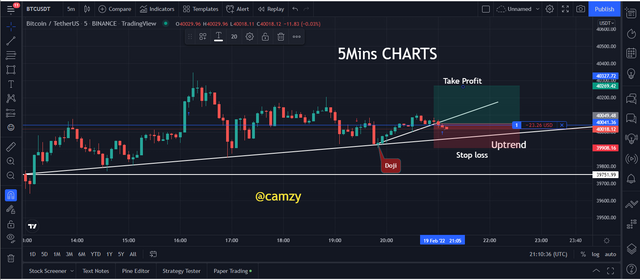
On the 5mins chart, we see a continuation of higher highs and high lows. we take place our stop loss at 1:1 stop loss and proceed for a buy position
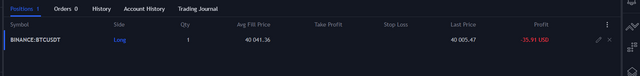
The above is the result of the trade.
Technical analysts use price action to help understand and predict the direction of prices. Price action is a reflection of human emotions and psychology, and can be analysed using charts containing historical data patterns.
While Japanese candlesticks is a common preference for technical analysis, consider that multi-timeframes can help to filter noise and provide insight into entry strategies. Reduce risk by understanding and using multi-timeframes.
I learned how price action can be interpreted, and which types of movements to watch out for when trading crypto. thanks @reminiscence01
IMAGE REFERENCE: TRADINGVIEW
