Fibonacci Tools - Steemit Crypto Academy |S6W4| - Homework Post for Professor @pelon53
Welcome to week 4 of the academy, today we are understudying an interesting topic about fibonacci tools. it was excellently delivered by @pelon53 and I will put down my understanding below


I'm going to be discussing the Fibonacci retracement theory of technical analysis. There are many financial tools to measure the inflow and outflow of money in the market. Technical indicators, chart patterns, candlestick patterns, and Fibonacci retracement are some tools that traders use in their technical analysis.
Fibonacci retracement is a popular tool in technical analysis. This is mainly used to locate support and resistance levels on the price chart. It has something to do with the Fibonacci numbers, which were developed by mathematician Fibonacci Pisa. People realized how useful these things are in real life, so they thought that these should have application in finance too. The fibonacci retracement tool is designed to have significant fibonacci ratios which are able to reverse the price if it touches the level.
Fibonacci retracement is a technique that is used when there are clear trends in a market. They are drawn by starting from an extreme point to the high or low area of an uptrend or downtrend in a market. The fibonacci levels that are used in this context are 23.6%, 38.2%, 61.8%, and 78.6%. 50% was included because it's the midpoint, which we know is significant.
We know that when there's a trend, the price will move in the direction of the prevailing trend but then pull back to correct the impulsive move. The end of this correction is a key level for both traders and investors to jump in. Fibonacci retracement helps identify these levels where support and resistance are present.
.PNG)
The Fibs retracement tool can be used to identify a potential reversal in price after the extremities of a downtrend. It is found at levels 0.382 along the Fibonacci sequence where we see resistance on the price action.
Here we are discussing fibonacci extensions, a way of identifying targets which is done by predicting how far the market could extend before changing direction.
Traders use fibonacci extensions to predict how far the next wave can go before the price turns or reverses. When the price reaches one of these horizontal points, it's likely to change direction and traders take profit at that point because it is a significant level.
Fibonacci extensions are horizontal price levels plotted on the chart. As they are drawn by using three specific points, you can use them to make future predictions about a certain asset’s price and how it will react to certain situations
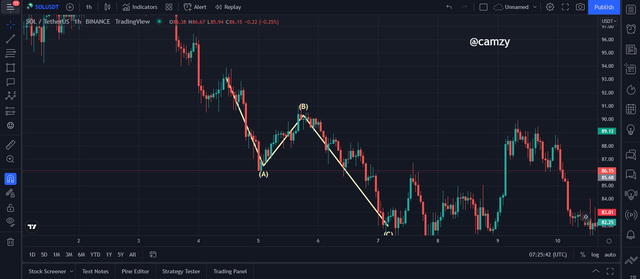
Shown above is how to plot the Fibonacci extension tool. The start of the trend is marked as (a), the end of the trend as (b), and finally, the point where price is expected to hit before a pullback, marked as (c).
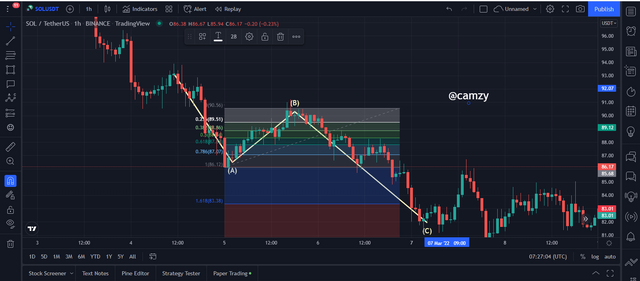 **
**From the chart, after studying the Fibonacci extension tool, we can see that before retracing, price was furthered by the 0.786 Fibonacci extension level before a pullback.
Fibonacci levels are all key levels, making them important for identifying high probability trades. You should be aware and trade accordingly if price approaches any of these levels.
For this question, I will e using the formula below
Rx = X + [[1 - % Retrace1/100] * (Y – X)}
where
X = the price of the asset at the beginning of the fibonacci
Y = the price of the asset at the end of the fibonacci
Rx = Consisdered Retracement
As we all know, on the fibonacci there are different levels of retracement which are
% Retracement 1 = 23.6%
% Retracement 2 = 38.2%
% Retracement 3 = 50%
% Retracement 4 = 61.8%
% Retracement 5 = 78.6%
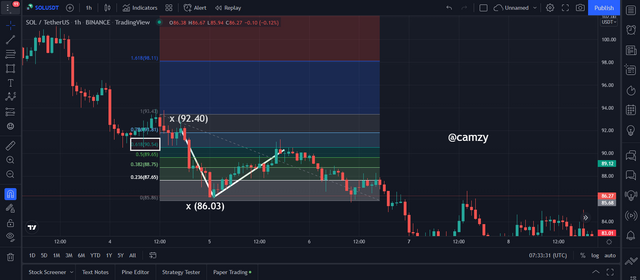
Having stated all this let's calculate the retracement for 0.618 and 0.236 on the SOL/USDT chart below
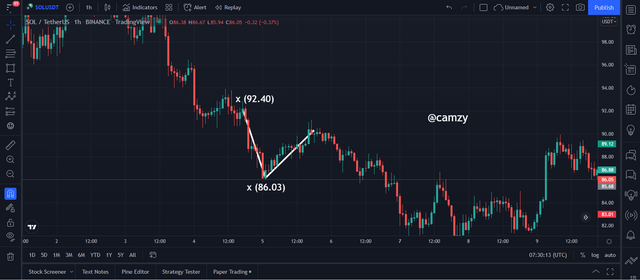
from the SOL/USDT chart above, we can see the levels of X and Y where
X = 92.40 and Y = 86.03
with the following data, let's calculate for the 0.618 retracement
Rx = X + [[1 - % Retrace1/100] * (Y – X)}
Rx = 92.40 + ((1-0.618)* (86.03-92.40)
Rx = 92.40 + (0.382 * -6.37)
Rx = 92.40 + (-2.433)
Rx = 89.97
CALCULATION FOR 0.236
Rx = X + [[1 - % Retrace1/100] * (Y – X)}
Rx = 92.40 + (1-0.236) * (86.03-92.40))
Rx = 92.40 + (0.764 * -6.37)
Rx = 92.40 - 4.8667
Rx = 87.53
I will be carrying out a Real trade in this section, Using my binance
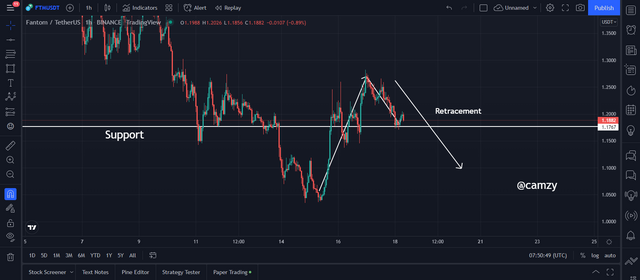
From the FTM/USDT chart above, we can see that the price initially was on an uptrend then hit a certain high and turned to the bearish trend which in turn gets to a support and returns for the bullish trend. I drew my analysis and proceeded to add the fibonacci extension.
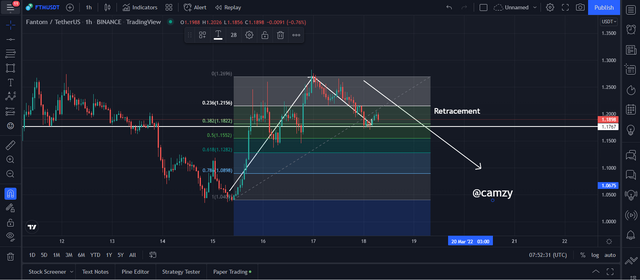
I drew my fibonacci extension using the 3 points which I marked out on the chart and the image below was displaced showing levels of possible retracements.
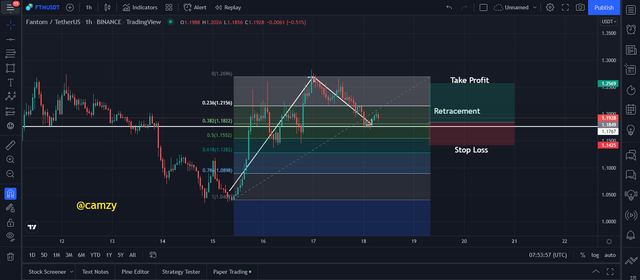
I placed my stop loss and take profit at a 1:2 RRR to ensure maximum profit then I place my trade. Then immediately went to my binance. Below are the details of my verified binance

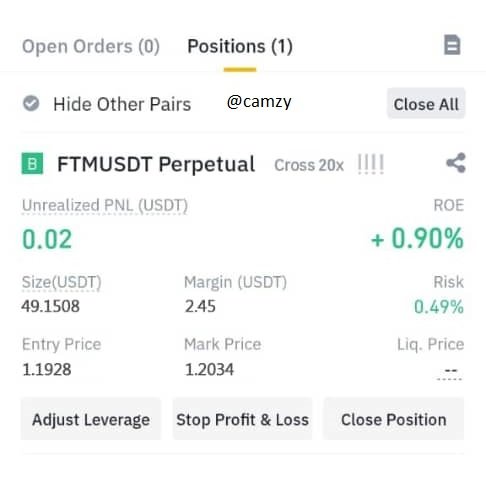
Here are the details of my trade as I watch to close the trade after maximizing profit
I will be carrying out a demo trade in this section of the homework post
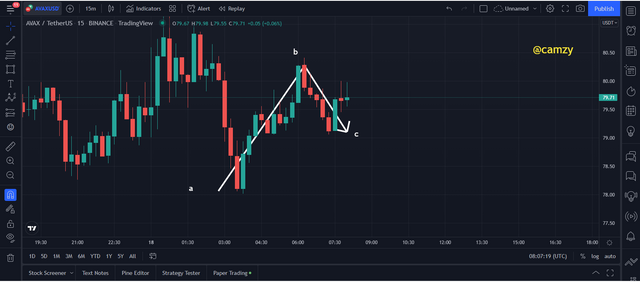
From the AVAX/USDT chart above, we can see that the price initially was on an uptrend then hit a certain high and turned to the bearish trend which in turn gets to a support and returns for the bullish trend. I drew my analysis and proceeded to add the fibonacci extension.
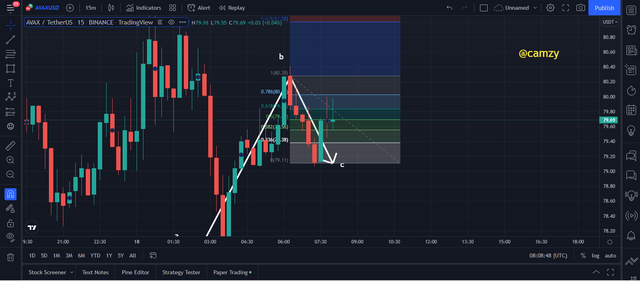
I drew my fibonacci extension using the 3 points which I marked out on the chart and the image below was displaced showing levels of possible retracements.
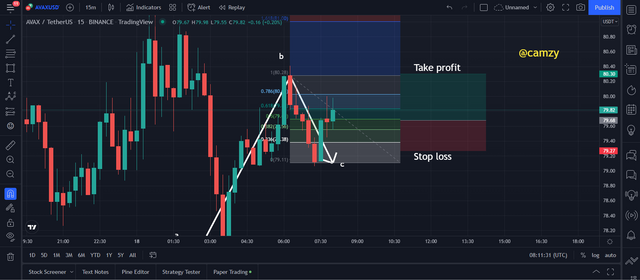
I placed my stop loss and take profit at a 1:2 RRR to ensure maximum profit then I place my trade. the stop loss on the chart was adjusted in that manner to enable everyone see both the stoploss and the take profit clearly.
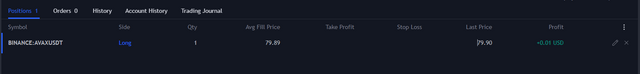
Here are the details of my trade as we can see above
Fibonacci retracement is a technique used to predict levels of resistance, support, and reversal in the market. Fibonacci extension focuses on profit targets based on retracements and lines drawn on charts.
Fibonacci retracement and extension are faster, but complementary. While it is easier to draw on a chart, it has to be done with other technical indicators - often making a more accurate retracement.
THANK YOU @PELON53