Psychology of Trends Cycle - Crypto Academy / S6W4- Homework Post for @reminiscence01
Hello It's @camzy again and today I will be doing the home work post for an interesting topic titled the Pschology of trends cycle. It was amazingly taught and I will be answering the following questions below

Dow Jones Theory says that the market can either be in a bullish trend when it consistently makes higher highs and lows, or it may be in a bearish trend when it makes lower highs and lower lows. It was developed by Charles Dow in 1897.
the Dow theory covers the talks more about technical anaöysis. Technical analysis is the process of analyzing price data to determine the trend direction, strength, and technical levels of an asset or market. Technical analysis can be done on virtually any asset or market. Price data reveals fundamental markets, news, and supply and demand information. This price information will help determine the state of the market and potential price movement as explained by Dow theory.
the theory explains that there are three types of trends: primary trends that last for months, secondary trends for weeks to a few months and minor trends for just a few days. Traders can take advantage of these trends after a detailed technical analysis.
The Dow Joe theory is important because it helps traders with determining the trends and gives them a basis on supply and demand. Moreover, this theory helps traders in predicting the direction of a market or trend.
In a trading cycle, the price of an asset will go up or down. In uptrends, prices continue to increase and might even have fluctuations in between. As long as the fluctuations bounce back up again and keep going upwards, then there is no need to worry.
This cycle will keep repeating in the market, where buyers eventually stop buying and start selling. At that point, sellers take charge of the market. This fundamental behavior leads to accumulation and distribution in the market.
ACCUMULATION PHASE
The accumulation phase points to the lowest point in a downtrend. In order for this stage to take place, the asset must have been trending down prior to this event. The selling pressure is always towards the downside during this phase and there will be high volume in a downward direction. As long as the price remains underpriced, sellers close off their positions, ultimately reducing the selling pressure.
When the trend is bearish and buyers continue to buy, there will be a tug of war between the two parties. At some point in this cycle, sellers will catch up and reclaim their sense of control over prices. When buyers finally overpower the sellers, the trend changes from bearish to bullish.
At the end of a bearish trend, professionals close their sell position, trapping retail traders with less experience. The accumulation phase is initiated because strong hands are waiting for the perfect investment opportunity to enter the market.
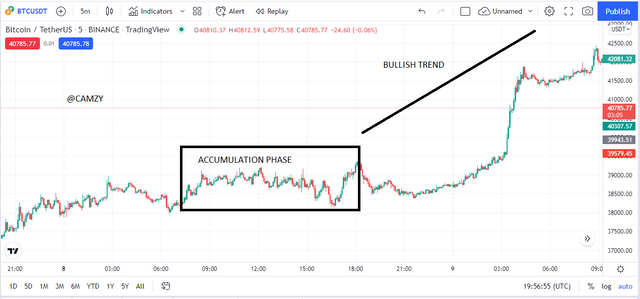
Additionally, the bullish trend will become invalid if the price breaks below the reaccumulation phase on the day's chart.
DISTRIBUTION PHASE
Distribution occurs at the end of a bullish trend, opposed to the accumulation that is at the end of a bearish trend.
When professionals, institutions or big players in market take over the market, they will start to close their positions. The result is that prices experience a slow movement and retail traders also close their positions at a loss. This causes a sideways market called the distribution phase. Their aim of creating this phase is to trap and haunt retail traders in the market.
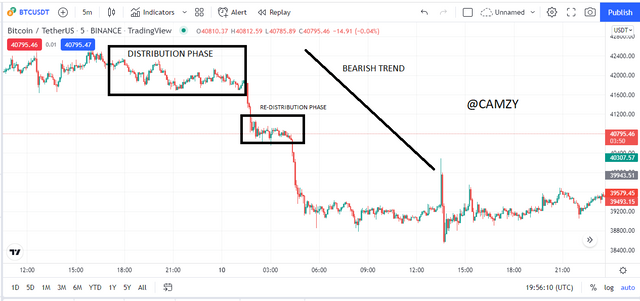
The screenshot shows a distribution phase, after which market competition between buyers and sellers leads to a certain price, below the distribution zone. However, at one point the big investors who bought early on took some profit and this allowed sellers to join in and continue riding the downward trend for a time. This is called a redistribution phase, which can be seen as a second distribution phase.
there are majorly 3 phases of the market and I will be explaining them below with corresponding screenshots.
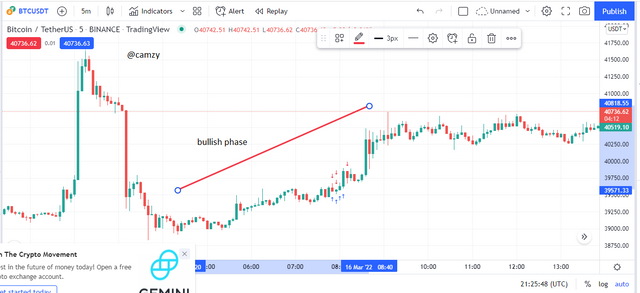
BULLISH PHASE
when there is an increase in the price of an asset over time creating consequently higher highs and higher lows. when a bullish trend occurs it shows demand over supply indicating that there are more buyers than sellers in the market creating buying pressure pushing the price upwards.
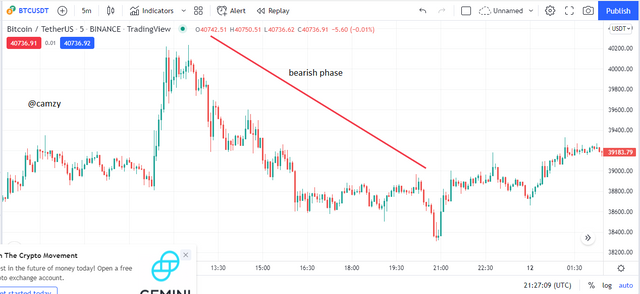
BEARISH PHASE
when there is a decrease in the price of an asset over time creating consequently lower highs and lower lows. when a bearish trend occurs it shows supply over demand indicating that there are more sellers than buyers in the market creating selling pressure pushing the price downwards.
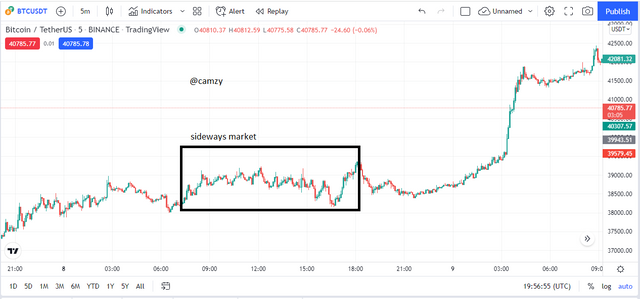
SIDEWAYS MARKET
This is a phase where volatility remains low and the volume slows. This could be a result of strong hands, or big players in the market. This can happen either during accumulation or distribution phases, and price will bounce back when touching support or resistance levels until it has enough momentum to break one of these levels for the traders to determine whether it is a reversal or continuation.
Dow theory states that the volume of trades at a specific phase of the market has a direct correlation to the price of that cryptocurrency asset. For instance, at a bullish phase of the market where you have high volatility, it is indicative of people wanting to buy the cryptocurrency; or at a bearish phase, where you have an excess supply, it means people are trying to get rid of their cryptocurrencies.
Likewise in the side market, In a phase where supply and demand on an asset are equal, the volume indicator will assist you in quickly understanding the amount of transactions on that cryptocurrencies chart. It's handy for confirming buy/sell transactions during different stages of the trend.
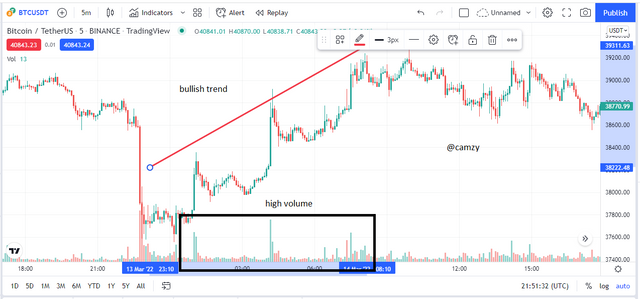
I can identify if the market is bullish by identifying the phase of the market in my image. I added a volume indicator so you can see that the highest volume occurred when the market was in a bullish phase, where it has low volume when it's retracing, and then again high volume when it is shifting towards a bullish trend.
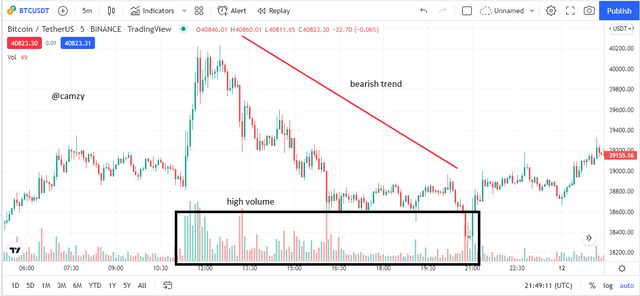
The volume is high in the bearish trend, which serves as confirmation to my market structure even though I may have set it up myself.
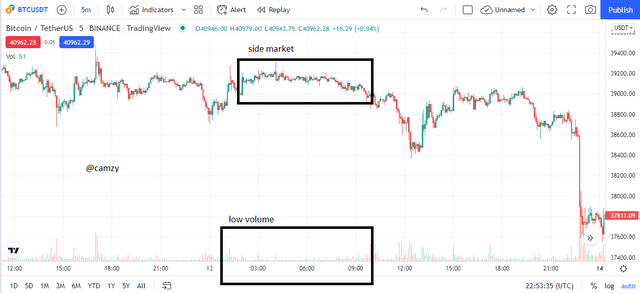
Volume is low during sideways phases, when price has a similar range. We can therefore conclude that volume is an accurate way of confirming the state of a cryptocurrency market.
There are several criteria that determine an entry in all 3 phases of the market and I will be explaining them below
BULLISH MARKET PHASE
The phase of the market must be bullish, with high highs and high lows. The volume indicator must have a higher volume of buyers.
The analyst should wait for a retracement of the trend and enter an impulse move away from that retracement in order to buy stocks.
The placement of this stop loss is below the support level and it prevents any major losses.
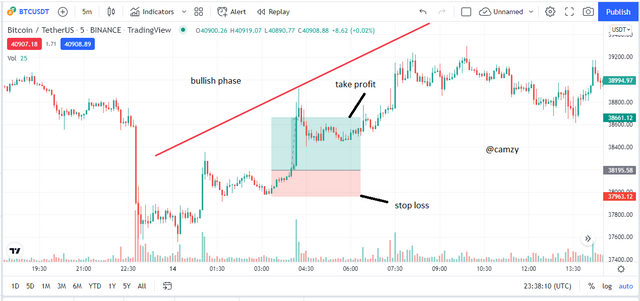
In my chart analysis, the market is bullish and pricing movement has been signaled by higher highs, higher lows, and volume. After a retracement trend, I made a long entry when volume seemed to indicate the purchase of stocks. I set my stop-loss and take profit at 1:2 RRR level below low formed by the retracement trend on the assumption that if there is a reversal, it would begin at this low point.
BEARISH MARKET PHASE
The phase of the market must be bearish, with lower highs and lower lows. The volume indicator must have a higher volume of sellers.
The analyst should wait for a retracement of the trend and enter an impulse move away from that retracement in order to sell stocks.
The placement of this stop loss is above the resistance level and it prevents any major losses.
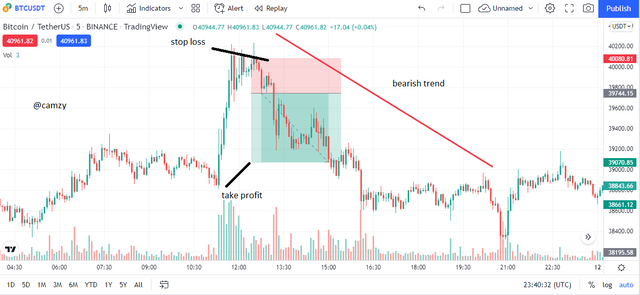
In my chart analysis, the market is bearish and pricing movement has been signaled by lower highs, lower lows, and volume. After a retracement trend, I made a short entry when volume seemed to indicate the sell of stocks. I set my stop-loss and take profit at 1:2 RRR level above the resistance formed by the retracement trend on the assumption that if there is a reversal, it would begin at this high point.
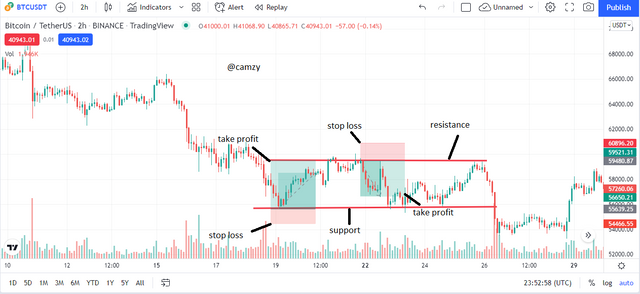
SIDEWAYS MARKET
draw the support and resistance line to serve as guidance for your entry and exit as the ranging market can be very risky
for a buy place your stop loss at the support and your take profit close to the resistance preferably a 1:1 RRR
for a sell place your stop loss at the resistance and your take profit close to the support preferably a 1:1 RRR
For this task, I will be entering 2 trades for a short and a long trade which is also a sell and buy trade
SHORT TRADE
For this trade, I will be using the ZEC/USDT chat on a 1min time frame after noticing series of lower highs and lower lows and I could detect the market was in bearish condition. I placed my stop loss and take profit at a 1:2 RRR
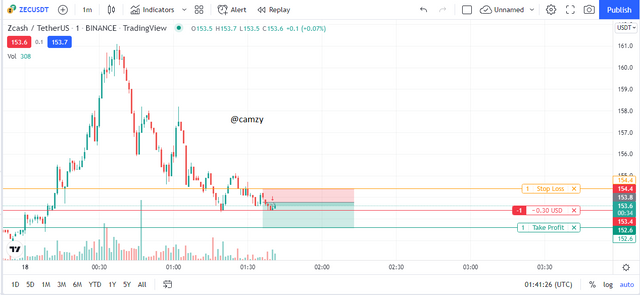
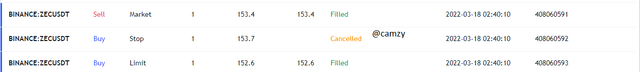
below is the detail of the trade entered for the short or sell trade

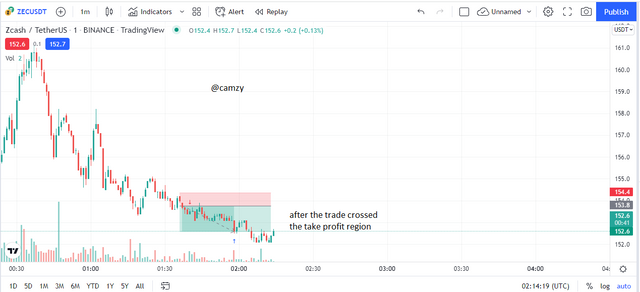
from the trade above, we can see that it is already making profit on the sell trade because we were told to allow the trade cross the take profit point and get filled
below is the image of the chart
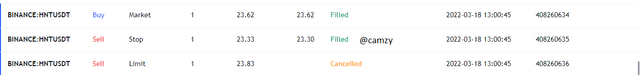
LONG TRADE
For this trade, I will be using the HNT/USDT chat on a 5min time frame after noticing series of lower highs and lower lows and I could detect the market was in a ranging condition with series of higher highs and lower lows. I placed my stop loss and take profit at a 1:1 RRR
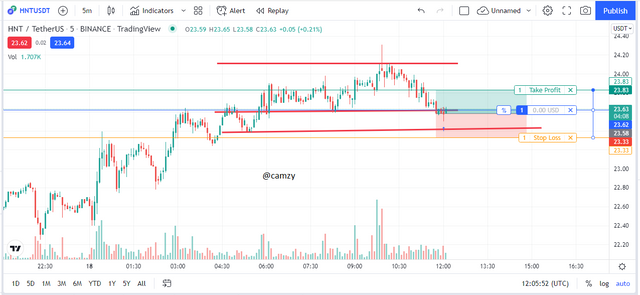
below is the detail of the trade entered for the long or buy trade
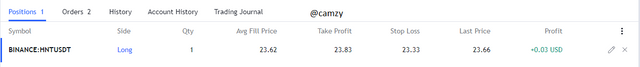
from the trade above, we can see that it is already making profit on the sell trade because we were told to allow the trade cross the take profit point and get filled
The Dow Jones Theory is important because it shows how the different phases in a financial market are part of a cycle. It explains bullish, bearish and sideways conditions, and has been an influential part of many other theories around trading.
By understanding the patterns of institutional traders, one can accurately predict the trends of the market, which leads to a higher opportunity for success in trading cryptocurrencies.
BEST REGARD
@reminiscence01
Great post @camzy
shared this with the Crypto Defrag community, RESTEEMED and upvoted
If you interested in idle upvote consider joining @schoolofminnows, the school if giving around 400 upvotes per post at the moment.
post from our developer: https://steemit.com/voting/@lanmower/school-of-minnows-is-a-free-value-added-service-that-makes-you-money