Support and Resistance Breakouts - Crypto Academy / S6W3 - Homework post for pelon53
Welcome back for the week 3 of learning in the crypto academy, It has been an amazing journey and I am glad to be part of this academy. Today we will be dealing on an interesting topic about the support and resistance of an asset, the professor has delivered the lecture excellently and I am going to be answering the questions based on my understanding


Technical analysis is the most important form of trading analysis available, as it lets brokers understand how traders are interacting with the market. The key technical indicators of every trader's attention are support and resistance levels on a chart. Before any traders make any decision about the market, they first understand what price is doing at these levels.
The market experiences a break at these levels because there are many people buying and selling in this range. The reaction is triggered by the supplies and demands of prices which we call the support and resistance.
Support and resistance levels help traders to determine the potential for a price reversal or price continuation. If support or resistance is rejected, it becomes a reversal point. If a support or resistance level is broken, it continues the original trend.
With the help of support and resistance levels, traders are able to predict buy and sell points on the chart.
The idea of support and resistance is to predict when the price will reverse, but it's not always the case. If there is buying interest, a breakout happens. Similarly, if there is selling interest, the break below a support level would happen with continuation of that trend.
The resistance zone is a zone of high selling interest in the market, with mostly closed buying orders. A break-out from this level signals that buyers are pushing for higher prices to arise. Breakouts above the resistance levels may show strong buying sentiment and traders can take advantage of these breakouts by opening a buy position. For example, on the following chart, you can see that traders should take advantage of a breakout above the resistance level by opening up buy positions
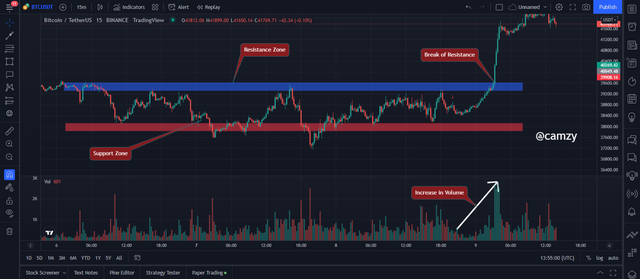
From the chart above, I identified the resistance and support zone on the chart and we can see the breakout on the resistance zone showing that the buyers are pushing beyond their previous limit. I also carefully marked out the volume bar below showing that there was an increase in volume of the asset which is a good criteria for a breakout.
In addition to giving traders a signal of potential trends, the support level gives traders an opportunity to book profits. If price reaches the support level and is rejected out of it, it’s likely that sellers are no longer interested in pushing stock price down. However, if sellers still have significant momentum, they may very well break through the support level to push prices even lower.
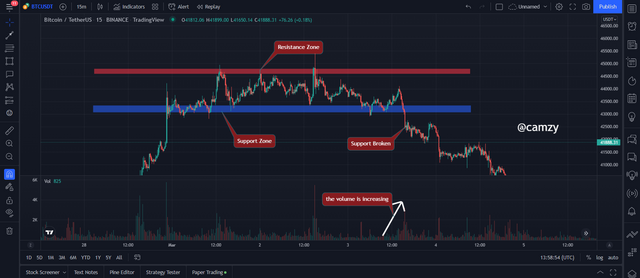
From the chart above, I identified the resistance and support zone on the chart and we can see the breakout on the support zone showing that the sellers are pushing beyond their previous limit. I also carefully marked out the volume bar below showing that there was an increase in volume of the asset which is a good criteria for a breakout.
Generally, false breakouts are carried out by big players in the market to generate liquidity. This means that a trader must be patient and not jump into the market after a breakout.
False breakouts can create huge losses, so confirmation is important before you act. Support and resistance levels are used to predict breakouts by identifying potential points of resistance in the market.
Let's see an examine the chart below
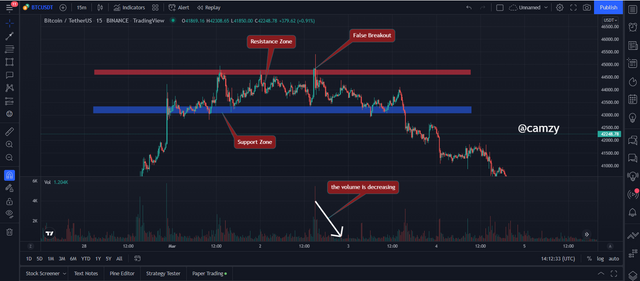
from the chart above, we can see the resistance and support zones carefully marked out and we see a rise in the price of the asset that breaks through the resistance zone temporarily and immediately turns to a reversal on the chart. this can also be identified due to the reduce in volume indicating a false breakout
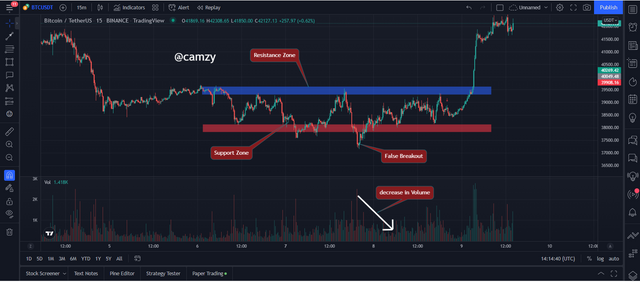
from the BTC/USDT chart above, we can see the resistance and support zones carefully marked out and we see a fall in the price of the asset that breaks through the support zone temporarily and immediately turns to a reversal on the chart. this can also be identified due to the reduce in volume indicating a false breakout.
How to avoid false breakout
False breakouts often dissipate after a short retesting period, so be patient and wait for the price to meet resistance before making a new play. This will confirm that the breakout is stable.
Also crosscheck the breakout with the volume indicator observing if there is an increase in the volume or a decrease. if there is no increase in the volume it is most likely that the breakout is false.
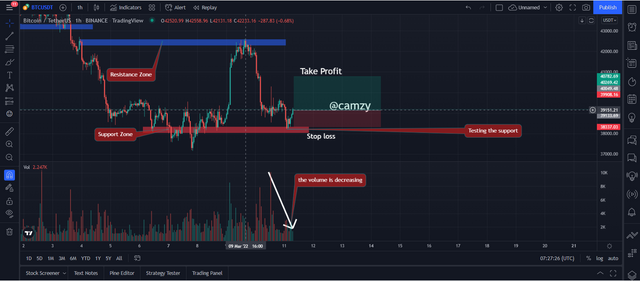
From the BTC/USDT chart below, we can see that the price breakthroughs the resistance zone giving a fake out and falls towards the support zone which in at this level as we anticipate a reversal.
vividly we can see that there is a corresponding volume response as the price breaks the resistance showing that there would be a possible reversal, and it is more advisable to place a sell order on the asset.
I place my trade at a stop loss and take profit of 1:2 RRR for a sell trade
After placing the trade, below is the results of my trade. The volume indicator can be used to filter signals before deciding if they are a valid sell entry.
.PNG)
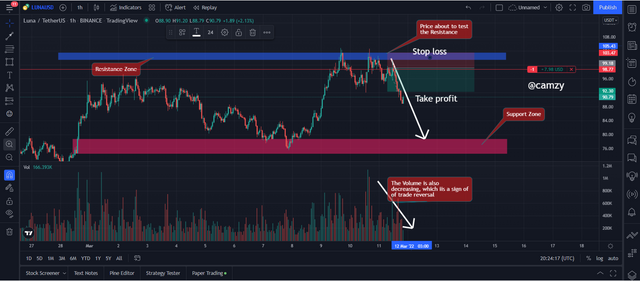
From the BTC/USDT chart below, we can see that the price breakthroughs the support zone give a fake out and rises up to retest the resistance zone which in turn falls back to the support zone at this level as we anticipate a reversal.
vividly we can see that there is a corresponding volume response as the price breaks the support showing that there would be a possible reversal, and it is more advisable to place a buy order on the asset.
I place my trade at a stop loss and take profit of 1:2 RRR for a buy trade
After placing the trade, below is the results of my trade. The volume indicator can be used to filter signals before deciding if they are a valid buy entry.

I know and understand the advantages of using indicators to find a breakout at a resistance or support zone, as well as the volume indicators and watching for fakeouts.
Beyond the professor's guidance, I challenged myself by performing trading based on real prices. In the end, I made a little profit and was happy with my results.
I thank the professor @pelon53 for this beautiful lecture and the standard of knowledge being released.
IMAGE REFERENCE: tradingview