Steemit Crypto Academy- Homework post for Professor @abdu.navi03 by (churchangel)

Hello Everyone and a warm welcome to steemit crypto academy season 6
1-Explain your understanding with the median indicator.
2-Parameters and Calculations of Median indicator. (Screenshot required)
3-Uptrend from Median indicator (screenshot required)
4-Downtrend from Median Indicator (screenshot required)
5-Identifying fake Signals with Median indicator(screenshot required)
6-Open two demo trades, long and short, with the help of a median indicator or combination that includes a median indicator (screenshot required)

QUESTION 1
1-Explain your understanding of the median indicator.
The median indicator can easily be identified as a trend based indicator which is meant for trend catching and easily identifying both entry and exit spots in an active market, the meidan indicator is a pretty straightforward indicator when the color of the median indicator is green then the trend is said to be an uptrend while when the trend is in a downtrend we can correctly tell the trend is in a downtrend as seen displayed pictorially below
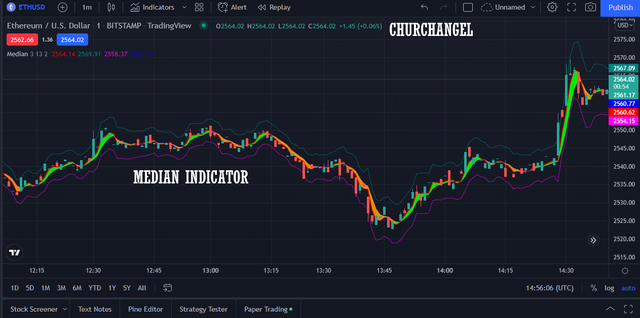
The median value is being plotted with an Average true range consisting of an upper band a lower band and a mid-value calculated by connecting swing highs and swing lows where the value found in between the band is known to be the mid-value. The upper and lower band can be likened to a volatility indicator while the line in between is seen as the mid-value for both the upper and lower band.
The median indicator being a trend-based indicator can be used as a standalone tool to predict future price movements and perceive possible market entries, the indicator has a bit of an advantage over other trend-based indicators like this one not only helps you predict future trends but shows you a volatility band where the price action is expected to stay 80% of the time a breakout in the indicator could be used as an indication of a trend reversal
QUESTION 2
2-Parameters and Calculations of Median indicator. (Screenshot required)
To observe the median indicator parameters i would like to utilize the Tradingview.com platform to exhibit this exercise
Step 1 would be to add the indicator and click on the settings button
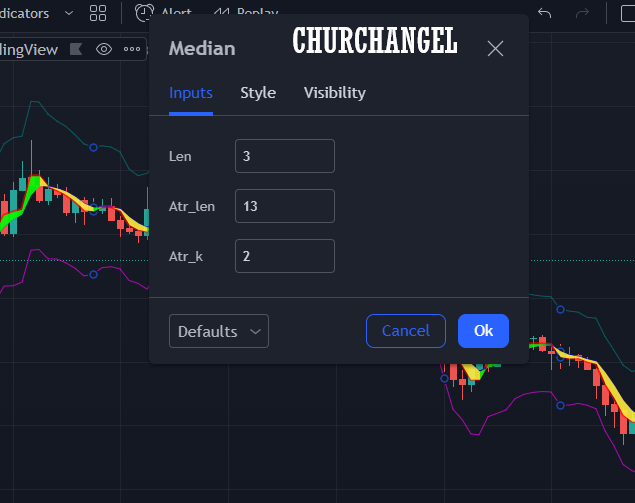
The first aspect you will come across would be the Inputs which is probably the most important parameter in this aspect, if one wishes to change the number of periods averaged by this indicator or customize the length of the Average True Range, all these important changes can be made from the input aspect.
Next would be the style aspect
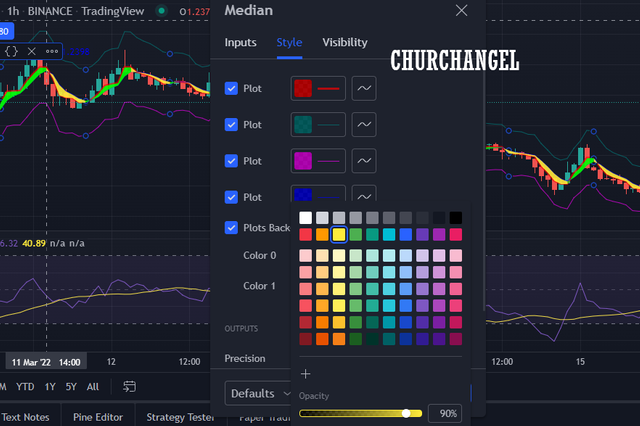
The style would determine the appearance of our Median indicator, playing around and changing colors in this aspect would randomly customize our indicators appearance, for my downtrend i customized mine to a custom yellow color
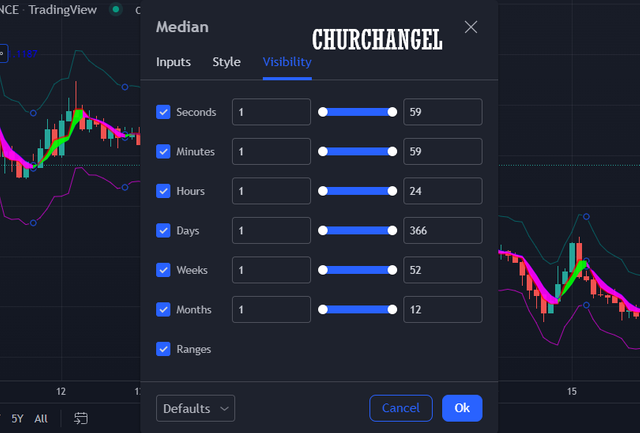
And lastly, we have the visibility tab which we can use to manipulate our timeframe
CALCULATIONS OF THE MEDIAN INDICATOR
The median value for the indicator is gotten by Adding the Highest value by the lowest value and dividing the value gotten by 2
The ATR is calculated by multiplying the previous ATR value and adding it by the current true range and all this is divided by the selected time frame
- The average price gotten for a custom number of a period range is gotten by adding the total open or close of the period and then dividing the result by the total number of periods calculated
QUESTION 3
3-Uptrend from Median indicator (screenshot required)
The uptrend in the median indicator is often easily perceived, for those traders who are opportunists and only trade trends the median indicator would be a very easy to use and stress-free indicator to be used, the indicator sends entry signal to traders by a mere glance at the chart.
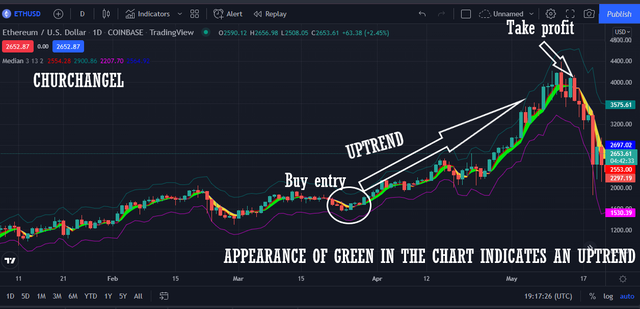
The Uptrend can easily be perceived with the help of the appearance of green color in the indicator, whenever a bullish trend starts it is subsequently followed by the district color green, traders who are keen on using this indicator solely can open a buy signal after green is seen in the chart.
Traders who are using this indicator can use this indicator solely to determine entries and take profit, when a buy position is opened one would have to be active to close a trade or take profit when the trend starts to reverse, with the median indicator one can tell when to take profit when the color yellow appears
QUESTION 4
4-Downtrend from Median Indicator (screenshot required)
A downtrend can be likened to the direct opposite of the uptrend, The downtrend can as well be easily perceived as the only way to tell when a trend has begun with the help of the median indicator is by observing the changes of colors, in my own case m downtrend was customized to carry a yellow color for more distinctive view.
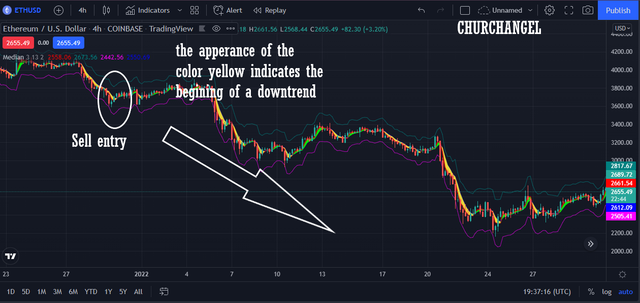
Once the purple color has been observed the entry can be made and the stop loss or take profit is often taken manually when the color changes from yellow to green. Being a trend indicator one can make sell orders from the median indicator solely and take profits can also be placed by closely observing the indicator.
QUESTION 5
5-Identifying fake Signals with Median indicator(screenshot required)
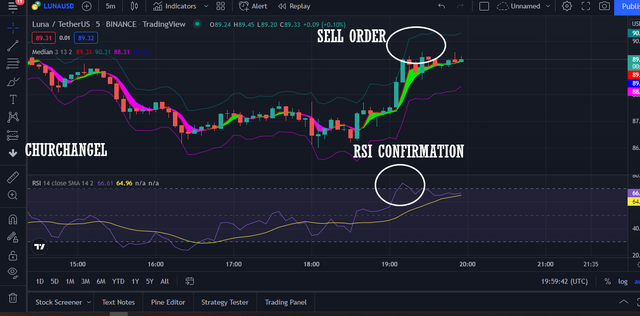
The median indicator when paired alongside a momentum-based indicator RSI can be used to filter false signal, the trend-based indicator would be used in this case to perceive buy and sell signals while the momentum-based indicator can be used to to confirm or filter our entry and exit signals.
They are occasions when the trend indicator will display a green color and immediately revert in situations like this one should not rely solely on the median indicator,
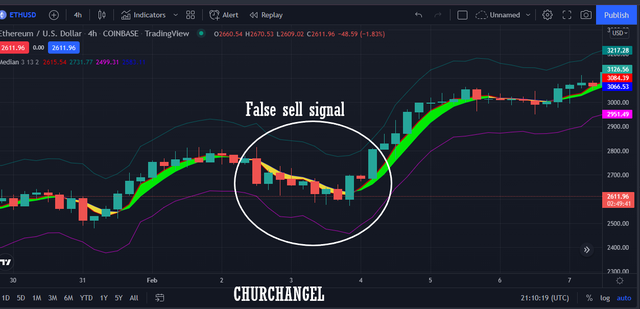
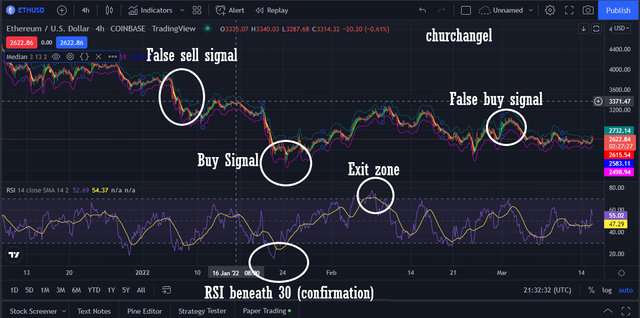
As we can see from the image above our sell signal started and ended almost immediately reverting back to a bullish trend as seen by the appearance of the greens in the chart, in situations like this we can not be solely depend on the meidan indicator. To properly filter out fake signals we use the Median indicator in conjunction with the RSI to better understand and make better entries, The RSI has a range of 70% upward for the overbought region indicating a downtrend is around the corner and a range of 30% downward indicating oversold indicating that a reversal to bullish is to be anticipated.
For buy entries in this case we will use one of our indicators to perceive entry signal and use the other to confirm trend entry, For instance, for a buy entry our RSI would have to be below 30% and our Median indicator would be turning gree while for a sell order our RSI would have to be above 70% and our median indicator is just turning yellow. A pictorial example can be seen below
6-Open two demo trades, long and short, with the help of a median indicator or combination that includes a median indicator (screenshot required)
I will be using my insight gotten from this class to make my buy and sell entries using the median indicator and the RSI for confirmations.
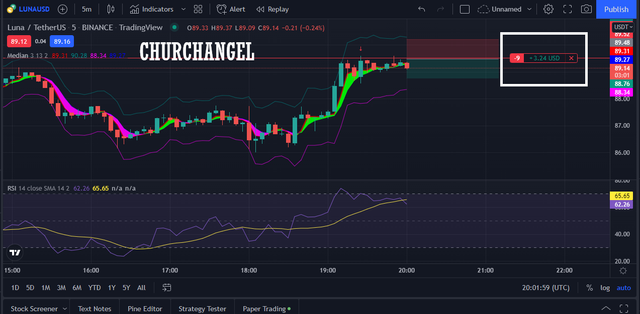
SHORT ORDER
In this case, we will be using our RSI as our signal indicator, we know that taking trades without confirmation has a lot more risk involved a the same time is more lucrative, and pays more. In this case, I will be perceiving my signal with the RSI indicator and confirming my entries with the Median indicator
LONG ORDER
For the long order, I made my entry in the OGN/USDT pair when my asset changed from downtrend color to the color green and our RSI indicator was reading at 27 pictorial details below
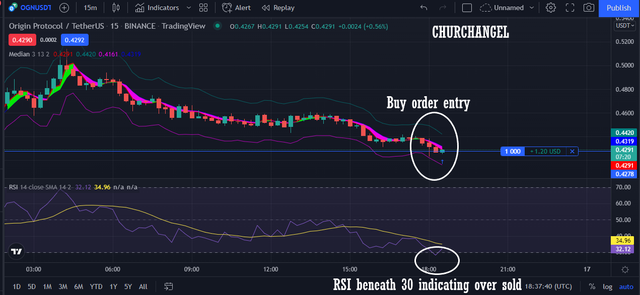
As we can see from the OGN/USDT chart our initial entry position was gotten from the RSI indicator cause it, first of all, showed an oversold signal long before the color of the median indicator changed to green, the entry was confirmed after the median indicator turned green and showed a reversal in trend
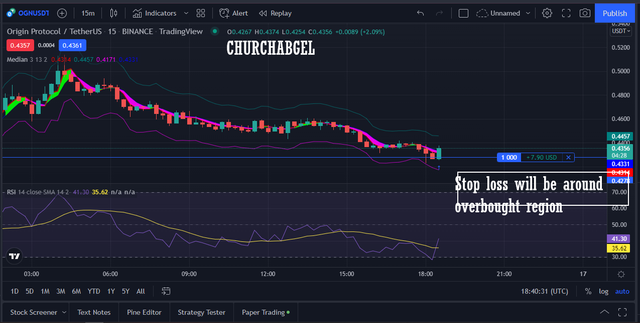
A profit of 7$ was being made and at the moment i set a stop loss ratio of 2:1 and my take profit was met at 13 dollar
CONCLUSION
The RSI gave the indicator some more accuracy, the median indicator helps one catch trends early by displaying different colors for uptrend and down trend, we use the RSI as a secondary indicator to better our entry and exit positions.
cc: @abdu.navi03
all screenshots used in this task were gotten from Source