Steemit Crypto Academy | S6W2 | Homework Post for @shemul21

Hello Everyone and a warm welcome to steemit crypto academy season 6
Explain Your Understanding of Moving Average.
What Are The Different Types of Moving Average? Differentiate Between Them.
Identify Entry and Exit Points Using Moving Average. (Demonstrate with Screenshots)
What do you understand by Crossover? Explain in Your Own Words.
Explain The Limitations of Moving Average.
Conclusion.

QUESTION 1
Explain Your Understanding of Moving Average.
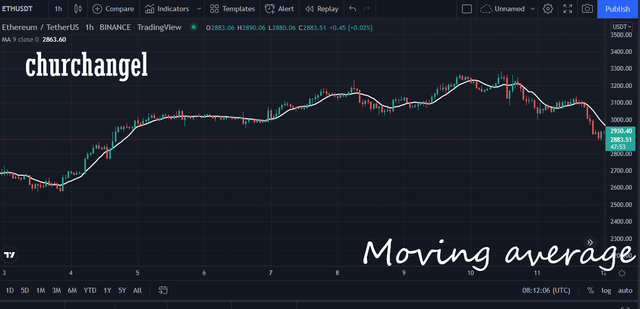
A moving average is a technical analysis indicator tool that smooths out an asset's price movement by comparing an asset's average price by it real-time price over a specified timeframe hence giving a much smoother price action movement.
We can also describe the technical indicator to be a lagging indicator that smooths out price action over a particular period that helps a trader perceive signals in a chart more clearly and helps a trader determine proper entry and exit levels. with Moving averages, we can be able to see price action which can not be seen normally using an ordinary chart, we can also use the moving averages to detect strong support and resistance levels in an assets price action. a pictorial example of a moving average below
QUESTION 2
What Are The Different Types of Moving Average? Differentiate Between Them.
We have three Moving averages which include
- SIMPLE MOVING AVERAGE
- WEIGHTED MOVING AVERAGE
- EXPONENTIAL MOVING AVERAGE
SIMPLE MOVING AVERAGE
The simple moving average as the name implies is the least complicated moving average of all the three moving averages, it is easily calculated by the summation of the market's most recent data within a specified or given time frame and dividing it by the number of total time periods
WEIGHTED MOVING AVERAGE
The weighted moving average is called so cause it lays more emphasis of more recent data points than the past data points, it is calculated by multiplying a data point by a weighted factor within a specific time frame selected, the WMA is used to tell trend at a glance when the price action is below the WMA it is considered a downtrend and vice versa
EXPONENTIAL MOVING AVERAGE
The exponential moving average is the third type of moving average, this M.A gives more emphasis to the more recent data points in the market hence tends to respond the fasetes to an assets fluctuation in a market frame within a specified time frame, it is calculated in three steps, first step involve first of all finding the SMA value , then calculate the wiegthed multiplier and lastly calculating the current E.M.A
DIFFRENCE BETWEEN THE THREE MOVING AVERAGES
1
Their formula for calculations are different
SMA = DP1+DP2+DP3.....DPn/n
dp= data point
n= total number for that time period
EMA = Current EMA = (Closing Price – EMA (Previous Time Period)) x W.Multiplier + EMA (Previous Time Period)
WMA = P1 X n + P2 X (n-1) X P3..... Pn/ (n X (n+1))/2
where p = price data while n = time period
2
| SMA | EMA | WMA |
|---|---|---|
| SMA relies more on past data points | Lays more weight to the most recent price points | Also lays more emphasis on recent data than past data |
| SMA is the least responsive to assets price fluctuations | EMA is the most responsive to a price fluctuations | averagely responsive to assets fluctuations |
| SMA is best used in long term trades | EMA is best or most beneficial in short term trades | It can be beneficial in both long and short term trades |
QUESTION 3
Identify Entry and Exit Points Using Moving Average. (Demonstrate with Screenshots)
The need to identify accurate entry and exit points in a crypto market cannot be overemphasized, as this will determine the success or failure of a crypto trader, to identify entry and exit points I would be making use of the three Moving averages observed above with custom setting
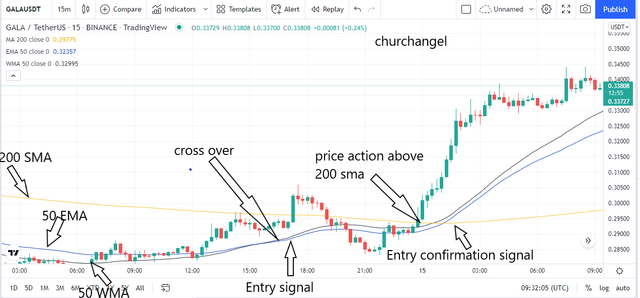
In the GALA/USDT pair, I used the Simple moving average with a custom length input of 200 to tell trend direction if the price action is seen below the 200 S.M.A line the trend is seen to be a bearish trend while if the trend is seen above the 200 S.M.A trend is seen to be bullish.
For entry signals and exits I use the E.M.A and W.M.A to detect and enter or exit an assets trade. I often look for cross-overs between the EMA and WMA and trend direction to detect and confirm entry or exit signals.
When an asset price action is below the 200 SMA and a cross over is noticed confirmation would for the signal would be seen when the price action crosses over the 200 SMA as seen pictorially below
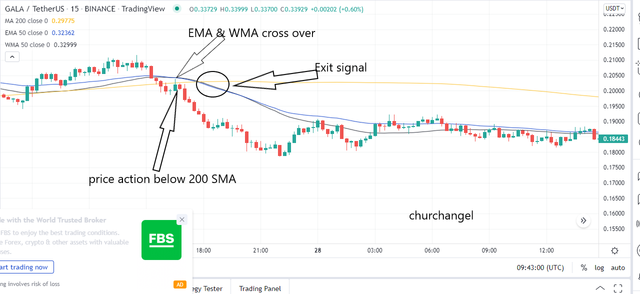
Exit signals can also be identified in a like manner, let's say instance we already made our entry in a bullish trend , exits can be identified when the price action moves below the 200 SMA and the other two moving averages i.e WMA and EMA have had a cross over, the former would serve as an exit signal while the latter would serve as an exit confirmation signal, pictorial example below
P:S, not every cross over between the EMA and WMA serve as an entry signal or an exit signal sometimes these crossovers happen very often as a result of low volatility in the market i would suggest one always waits for confirmatory signal from the 200 SMA crossover between the asset price action before entry
QUESTION 4
What do you understand by Crossover? Explain in Your Own Words.
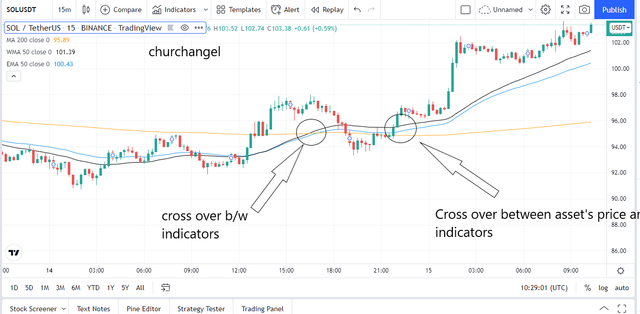
To the best of my understanding crossover can be seen as a particular point where two or more indicators in this case moving average cross between themselves or we can say a point where an assets price action and an indicator(moving average) cross over each other, an example can be seen below
Cross-overs in trading are often perceived as a signal of some sort for instance if an asset is seen to have a cross over and the cross over breaks out i the upward direction the trend is assumed to indicate a moment towards the bullish direction while if the crossover breakout in the downward direction a bearish trend is expected to follow
A crossover in many cases also depicts trend reversal, they are may crossovers but the two mist popular cross overs are often
- Golden crossover
- Death crossover
QUESTION 5
Explain The Limitations of Moving Average.
The moving average being a very basic does not reflects a lot of crucial information which can be critical when making entries or exits
The moving average only take note of the data within the given or specified period while other data outside the period are ignored and this might give one a misleading entry or exit signals
Constant modification of the M.A is required else one might be using an outdated data to analyse realtime market data and might end up with wrong analysis hence loss will follow
The moving average although a pretty grat indicator cannot be used as a stand alone technical analysis tool as it lacks some other crucial information for trading like volatility,momentum e.t.c hence it has or should be used alongside other indicator for increased chance of success rate.
Conclusion.
The moving average is one of the most used indicator in the trading world today but with that said it is well known that to increase your chance or success rate in trading one is advised to pair the moving average indicaptr with other indicators to increases success rate.
Moving averages can be used to spot very important informations in a market like trend reversal, crisis overs e.t.c, these informations can help one to correctly make the right entries.
cc: @shemul21