Trading strategy with RSI and ICHIMOKU]- Steemit Crypto Academy- Homework post for Professor @abdu.navi03 by (churchangel)

Hello Everyone and a warm welcome to steemit crypto academy season 6
1-Put your understanding into words about the RSI+ichimoku strategy
2-Explain the flaws of RSI and Ichimoku cloud when worked individually
3-Explain trend identification by using this strategy (screenshots are required)
4-Explain the usage of MA with this strategy and what lengths can be good regarding this strategy (screenshots required)
5-Explain support and resistance with this strategy (screenshots required)
6-In your opinion, can this strategy be a good strategy for intraday traders?
7-Open two demo trades, one of buying and another one of selling, by using this strategy
QUESTION 1
1-Put your understanding into words about the RSI+ichimoku strategy
The RSI and Ichimoku strategy is a 2 indicator-based strategy that was strategically selected to back each other's shortcomings in a crypto trading market, individually if we observe the indicators solely a lot of undersides will be discovered which might prove to be error-filled or lead to wrong analysis and entries.
The RSI indicators are known very well to give false signals during a trend and it does not take note of the volume of trade in a market all this is crucial information for someone that is about to make an entry. While the Ichimoku cloud has downsides like it is based on historical data hence it lags (slow response). Individually trading with just either of these indicators is going to be a bit misleading because one is going to miss out on important information crucial to making decisions on entry or exits
The RSI+Ichimoku trading strategy is a 2 part indicator strategy where the RSI is used to spot overbought and oversold areas in the trading market while the Ichimoku cloud plays a role in mapping out a support and resistance level and also indicates in some cases where a trend reversal is about to begin
QUESTION 2
2-Explain the flaws of RSI and Ichimoku cloud when worked individually
Like I said earlier these indicators individuals have their shortcomings
RSI
The RSI is a momentum-based indicator that measures the momentum of an asset by weighing between lower closes and higher closes, for that reason
The RSI can spend hours sometimes days without clearly showing if an asset are being overbought or sold, or in the case of when a trend is ongoing in the market it will be giving off false overbought or oversold signals which might lead to making the wrong entries or exits
The RSI is not a sole indicator, it has to be paired with others for higher chances of succeeding in a trade
RSI signals are much more beneficial when looked upon in a long term trend
The RSI is a technical tool that requires some level of expertise to handle, it is sometimes complex to discern signals, especially in cases of divergence, if one is not properly acclimatised he might end up making the wrong entry
Ichimoku cloud
Some of the flaws of the Ichimoku cloud includes
A major flaw that can be found in the Ichimoku cloud indicator is that it uses historical data to analyse realtime chart and in cases where the market behavior is not a repetitive one, a trader will perceive wrong signals
Another flaw of the Ichimoku cloud is that it always ends up giving a signal very late (It lags), before a trader percives the signal from the Ichimoku cloud indicator and make an entry the move is already exhausted and one can end up getting caught in a reversal
Another negligible flaw the Ichimoku indicator has is that it creates a lot of noise in the chart and requires a certain level of familiarity before one can properly analyze and manipulate the indicator
QUESTION 3
Explain trend identification by using this strategy (screenshots are required)
With the use of this RSI+Ichimoku strategy spotting trend is very easy,
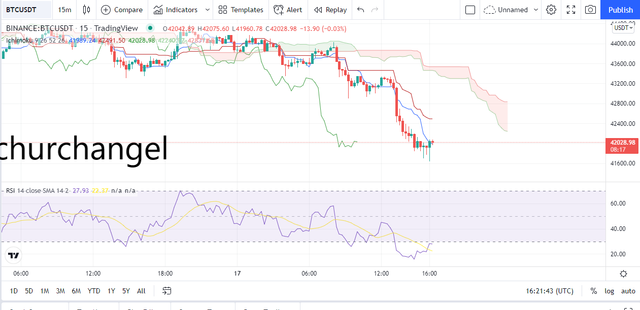
BULLISH
To spot a bullish trend using this strategy one would have to look out first of all to the RSI indicator as it is a momentum-based indicator, it has a scale of 0-100 and when an asset is found beneath 30 on the RSI that asset is said to be oversold likewise when an asset is seen above 70 the asset is said to be overbought, Bullish trend in the RSI are usually found in reading above 70
Now confirm our bullish trend in this strategy we would be using the Ichimoku, in the Ichimoku cloud to identify an uptrend one simply has to look out for the interaction between the price action and the cloud, for an uptrend we would notice the price action is above the cloud and the cloud is looking green in color as displayed pictorially below
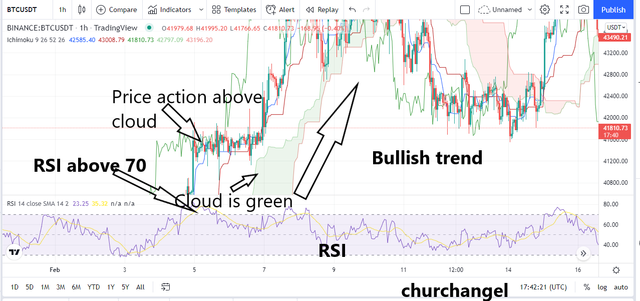
BEARISH TREND
A bearish trend, in this case, can be spotted in quite a similar way as the bullish but in a reverse manner, in a bearish condition the RSI would have to first be seen around the 30 levels while the Ichimoku cloud will be seen well above the price action and in this case the cloud would be seen in a reddish colour as shown pictorially below
QUESTION 4
Explain the usage of MA with this strategy and what lengths can be good regarding this strategy (screenshots required)
Like every strategy, the more comprehensive a trader's technical analysis is the better his chances of entering a successful trade, the Moving average addition will to some extent increase a users trading accuracy and tighten his success rate
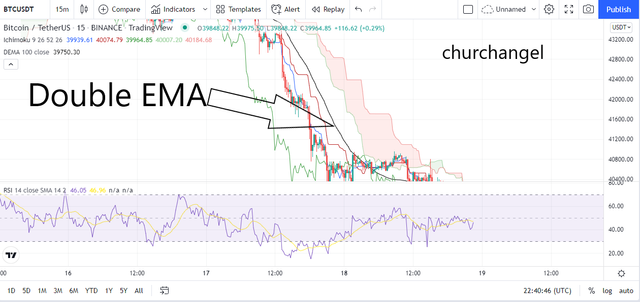
For my Moving average, I would be adding a Double Exponential Moving average, the Double exponential moving average is a trend based indicator used by traders to confirm signals either by or sell signals in crypto trade and is often perceived to be more accurate when used in a long term trade in that themDEMA uses two moving averages in the chart to remove lags and to quickly respond to fluctuations in the market
The Double Exponential moving average can be used to detect entry signals for buy order if the price action is seen below the Moving averages and sell entries when the market price is seen above the moving averages In confluence with the RSI and Ichimoku strategy one can use the DEMA to confirm entries and exits as the indicator does not lag.
QUESTION 5
Explain support and resistance with this strategy (screenshots required)
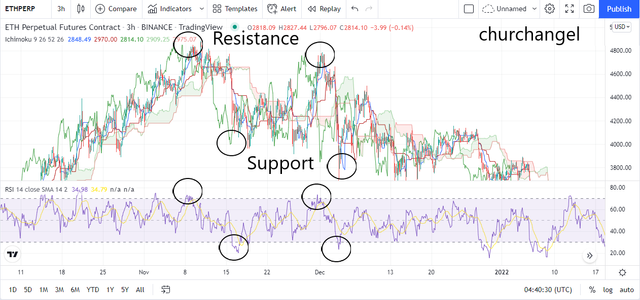
The support zone and resistance zone can in the case of a trend be located with the help of the Ichimoku cloud for reasons like the RSI gives off signals wrongly during a trend and we use the Ichimoku cloud to detect support and resistance cause its a trend-based indicator, while in the sideways market movement where there is no trend the RSI is always better caused here one can easily follow up with the overbought or oversold regions
TREND MARKET
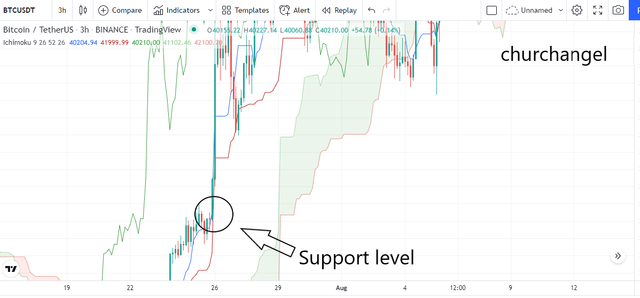
Like i said earlier due to certain factors mentioned above, in the trending areas we have to strictly Lean on the Ichimoku cloud to detect support and resistance levels. As we already know support levels in a trending market is a level created as a result of an asset's price reaction (has to be a minimum of two times) with a particular level on an asset, this is caused most often by a higher margin of buyers in a market than sellers at a certain level. To identify the support level we look for areas the price reacts with the ichimoku cloud and gets repelled, example below
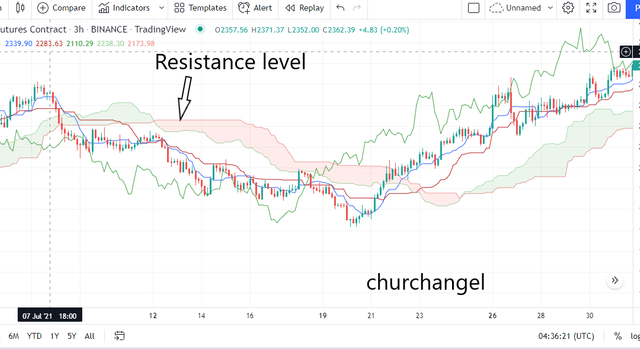
While the resistance level is identified usually atop a chart, it is known to be a level where an asset's price bounces back down or dips when reacted with. It is often caused by sellers selling more than buyers at a particular level in the market, hence creating a certain level where an asset bounces back off after reacting to it.
SIDEWAYS MARKET
Sideways markets are as a result of little or no volatility in an asset, in this case, we would be leaning on our RSI indicator taking close note at over sold and oversold levels
QUESTION 6
In your opinion, can this strategy be a good strategy for intraday traders?
YES
The basic requirement for a day trading strategy is met if a strategy is capable of identifying trends, identifying market or trend reversal, mapping out support and resistance level and trend directions, which this strategy clearly can
When entering a trade some basic information which is crucial before entry is needed, this information might include trend direction, current support level, resistance level, and entry positions, with the RSI+ICHIMOKU strategy one can perform a basic technical analysis and get all this information before making a move in the market so in a nutshell, any strategy that provides you with the crucial information needed for entry is good enough as an Intraday trading strategy.
QUESTION 7
Open two demo trades, one of buying and another one of selling, by using this strategy
For the course of this question, i will be opening 2 demo trades on my tradingview paper trading account.
SHORT
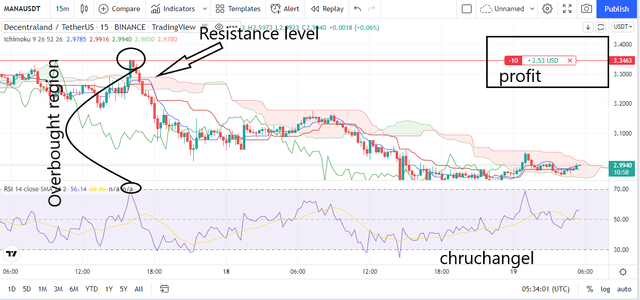
For my sell/short order we can see that from the RSI+Ichimoku strategy i was able to detect an entry position from first of all perceiving a short entry from a 3H timeframe, an overbought was noticed in the chart then a confirmation was perceived when the asset began to reverse after reacting with the resistance level. I made my entry in the MANA/USDT pair after the confirmation and a current profit of 3$+ is being made
LONG
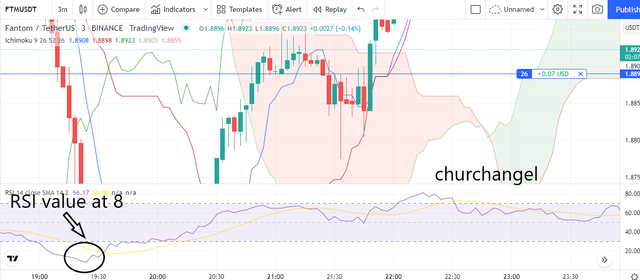
For my long trade, my entry was made in a sideways market where the market had a very little amount of volatility and we know in situations where there is the absence of volatility we have to lean solely on the RSI for our entry signals, from the screenshot presented below we can see that the market was at an oversold phase and our RSI has fallen beneath the range of 30
CONCLUSION
The RSI+ICHIMOKU strategy is a very standard strategy that can be used to detect perfect entry and exits in a trade,the addition of the moving average reduces the noise in the chart and helps in the confirmation of entries and exits also confirm trend reversal when a cross over is seen but generally, the strategy can be very effective for making entries.
cc: @abdu.navi03