[Crypto Trading with Price Action] - Crypto Academy / S6W2- Homework Post for @reminiscence01
.png)
Explain your understanding of price action
The price is an important factor to be considered when trading. When dealing with crypto assets we know that the price movement is really important as the price trends may trend upwards and downwards with time. The price action is the movement of price in a price chart with time. The traders have the ability to understand the market trends and take their trading decisions accordingly.
The price movement can occur as a result of the psychological conditions in traders' minds. When a seller needs to buy assets, he continues to buy assets to the maximum amount they can. Then also when a seller needs to sell assets he sells all his assets to whatever the amount prevailing in the market. When all traders think in this way, the total price action is affected by it, and fluctuations in price occur due to this condition.
When the buyers continue to buy assets the price action demonstrates an uptrend movement and when the sellers start selling their assets the price action demonstrates a downtrend. In this way time to time, the price shows upward and downward movement. This is known as the price action.
The investors and traders take a look at this price action before they invest or trade. This is known as "The price action analysis." Here the upward and downward movement of assets are carefully observed and they apply any technical analysis method to confirm their decisions. Here they select the best trade entry and exit points according to the price action.

What is the importance of price action? Will, you chose any other form of technical analysis apart from price action? Give reasons for your answer
The price action is important for investors and traders as it can be applied to any timeframe. This can be an all-time favorite of traders. There are many reasons why I use the price action analysis method in trading. I prefer to use the price action analysis combined with a technical analysis method to confirm my trade entry and exit positions.
Simplicity
- The first reason to depend on price action is the simplicity in it. To take the trade entry and exit points traders don't need to apply as many technical indicators and confuse the trading decisions. The price action gives the signals for trade entry and exit points. So, price action is even better for beginners to enter into trading as it is easy to understand. The complex ways of analysis can waste your energy and affect your mentality.
Real-Time signals
- Most technical indicators lag behind the actual price trend causing losses to the traders. When the price goes through a sudden break out some of the indicators fail to produce the signal. This is a major issue in technical analysis. The price action gives the solution for that. The price action uses real-time data and signals accurate price movement. the price action with the help of candlesticks signals exactly what is happening in the market.
Easy detection of Price
- The signals produced by the price action are easy and simple to understand. As most of the traders use the candlestick charts to examine the price, if they learn the types of candlesticks which denote uptrend, downtrend, and trend reversals it would be enough for the traders to learn the price action signals. There is no need for high qualifications to understand the price action of assets when trading.
Significance of time frames
- The time frame a trader use to observe the price action is also significant. Some traders use daily, weekly time frames as they consider it more reliable. Actually, when we use a higher time frame, it is easy and gives us the opportunity to have time to make decisions. There is no need of observing the whole day every single minute for the price action if we use a longer time frame. So it doesn't produce traders who overtrade.
Psychological behavior of Traders
- For price action traders, the behavior of the traders' minds also affects them in some or another way. When a trader has a psychological level to buy assets up to a certain amount creating a bull market, another trader may set up a short position thinking about a price reversal. Every trader has their own aspect of the trade. Traders are free to take their decisions in placing long or short orders.
Explain the Japanese candlestick chart and its importance in technical analysis. Would you prefer any other technical chart apart from the candlestick chart?
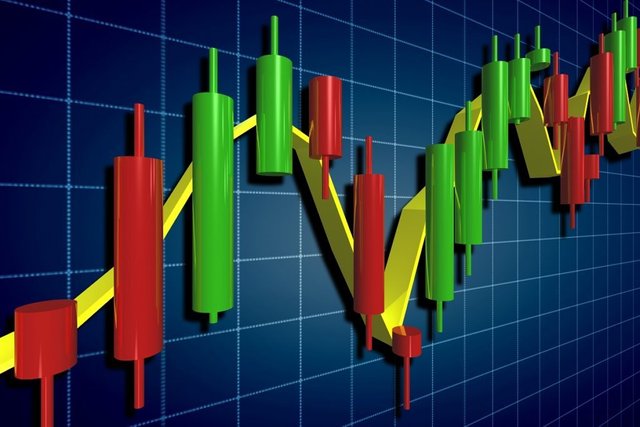
Japanese candlesticks are used as technical analysis and a charting method in determining the price action of an asset. In a price chart, the Japanese candlesticks are developed by the emotions of traders and as an effect of demand and supply of the assets in the market. It is a graphical representation of the price action. The candlesticks are of different colors defined as bullish and bearish. When the traders start buying assets the candlestick chart denotes it by some candlesticks which make upward movements in the chart. When the traders start selling the assets the candlesticks are formed to make a downward movement. In this way, candlestick charts form different price trends in the market. I would always use the Japanese candlestick charts as it is more clear and easy to spot the trend accurately. The opening and closing prices with highs and lows are clearly presented by the Japanese candlestick charts.
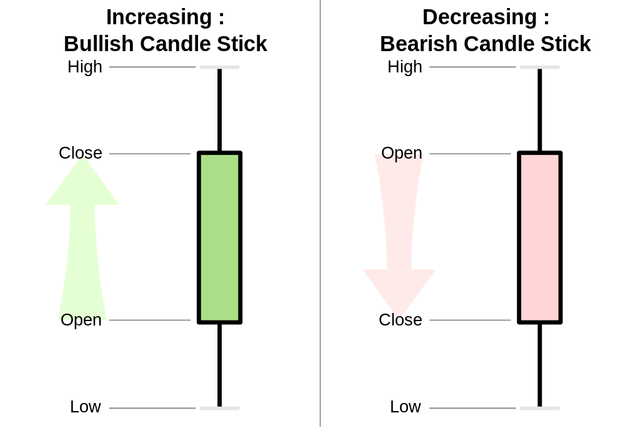
The candlestick contains 4 major parts which help the price action. The real body, high, low, open and close. The closing price decides whether the candlestick is a bullish or a bearish candlestick. These candlesticks are more visual and graphic which presents a clear picture of the price action.
Image
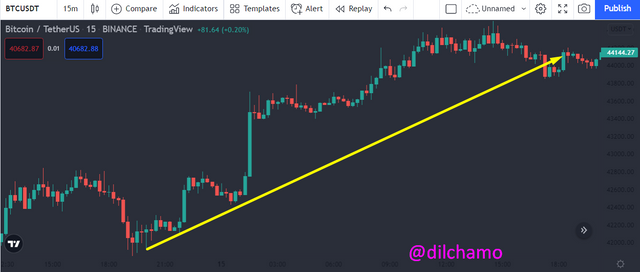
The above screenshot of BTC/USDT cryptocurrency pair shows a bullish trend which is demonstrated with a collection of more upward candles and fewer downward candles. In this chart the bullish candles are green and the bearish candles are red. The candlestick patterns show an uptrend in price.
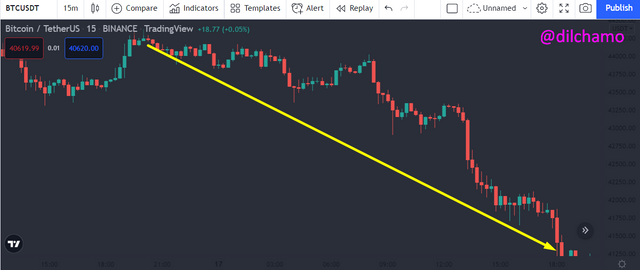
The above screenshot of BTC/USDT cryptocurrency pair shows a bearish trend which is demonstrated with a collection of more downward candles and fewer upward candles. In this chart the bearish candles are red and the bullish candles are green. The candlestick patterns show a downward trend in price.
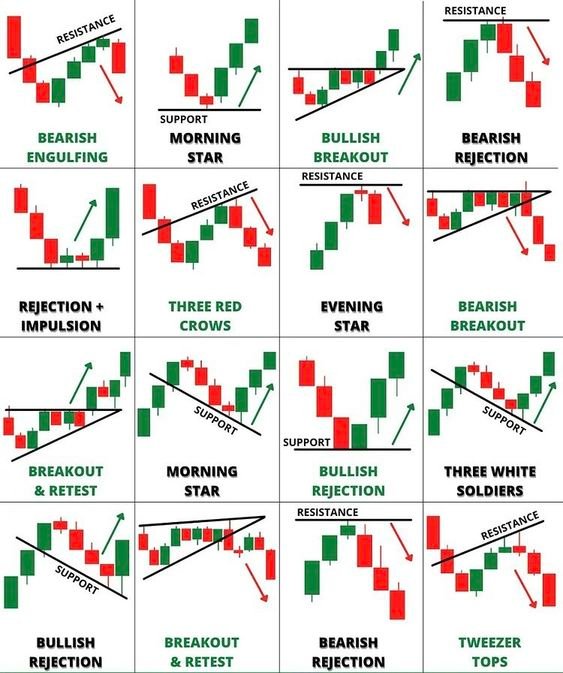
There are some candlestick patterns that are very common in understanding the price trend and also the trend reversals. The Doji candles and engulfing candle patterns demonstrate the present situation of the price and help to predict the future price action. With the help of the trendlines, support, and resistance lines we can decide the trade entry and exit points in a Japanese candlestick chart.
What do you understand by multi-timeframe analysis? State the importance of multi-timeframe analysis
We can understand by the name "Multi-timeframe" it is about considering multiple time frames. Here in trading, we use multi-timeframes to determine the trade entry points. We use different timeframes to observe the same cryptocurrency pair. Also, we can use two or three different time frames with a single technical indicator to spot the exact trade entry positions. We can use long-term, Medium-term, and short-term time frames to spot the positions. When using multi-timeframes traders are able to spot strong support and resistance levels. It leads them to go for strong trade entry and exit positions. This method gives a noise-free price action which is easy for traders. I will demonstrate it with an example.
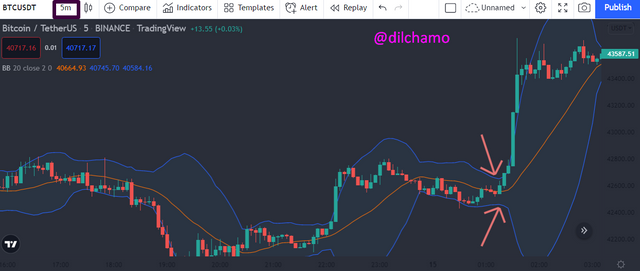
In the above screenshot, I have used the BTC/USDT cryptocurrency pair and I have taken a short-term timeframe of 5 minutes. I used the Bollinger band indicator to spot the accurate signal. The tightened Bollinger bands reveal a strong price action change. I have spotted a tightened Bollinger band and also the next is a huge upward movement of price.
Now I will apply the same indicator with a different time frame and I will spot the same tightened Bollinger bands to confirm my trade entry position. I should say that there is very little difference but still, I can confirm the signal in the 15 minutes chart as well.
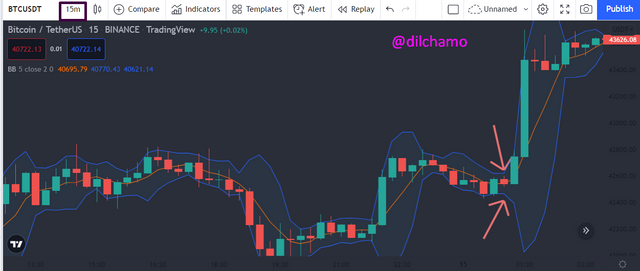
In the above screenshot, I have used the same cryptocurency pair of BTC/USDT pair with a 15 minutes range. I have spotted the same tightened Bollinger bands and see whether I can confirm the signal given by the 5 minutes chart.
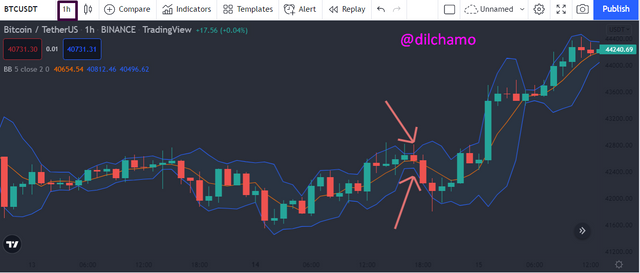
I will now go for the longer time frame of 1 hour time. Here also I have used the same cryptocurrency pair and I have indicated the same position in the Bollinger bands.
By analyzing all three timeframes I confirmed my signal. Here the short-term time frame gives a much closer position than the medium and long-term timeframes. How ever after clearing up the trend signal using the signal given by all timeframes I can decide by trade entry position.
With the aid of a crypto chart, explain how we can get a better entry position and tight stop loss using multi-timeframe analysis. You can use any timeframe of your choice
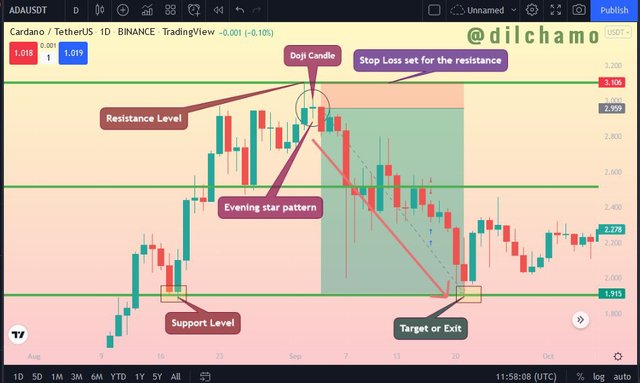
I have used the ADA/USDT cryptocurrency pair with a daily timeframe. The resistance level is identified as the stop loss point. The target point is identified at the support level. I have also identified a Doji evening star candlestick pattern and confirm the trade entry point.
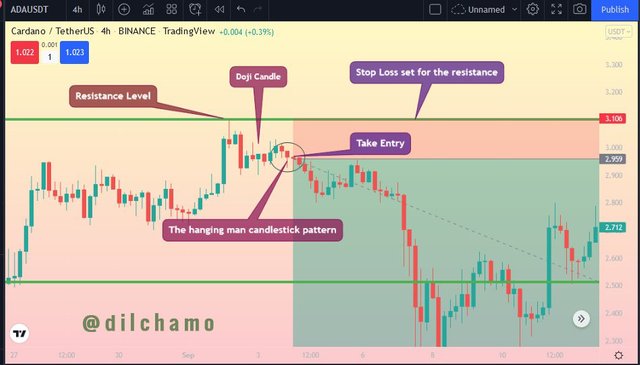
Then I used a 4-hour chart To confirm the trade entry. This time I identified a hanging man candlestick. The stop-loss is marked at the resistance line. The entry point is confirmed after identifying the hanging man.
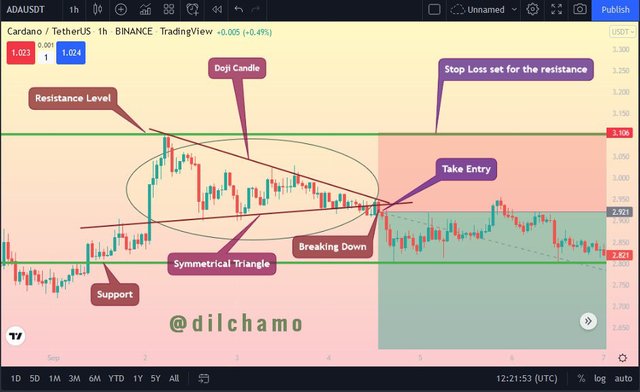
Then Used a shorter timeframe compared to the first image. I used a 1-hour chart to confirm my trade entry for the last time. Here, I could identify the support and resistance levels. The stop-loss is set for the resistance level. As you can see with the Doji candlestick I have identified a symmetrical triangle. I take the entry at the breakdown position. I can place the trade after the confirmation of the entry point with multiple timeframes.
Carry out a multi-timeframe analysis on any crypto pair identifying support and resistance levels. Execute a buy or sell order using any demo account. (Explain your entry and exit strategies. Also, show proof of transaction)
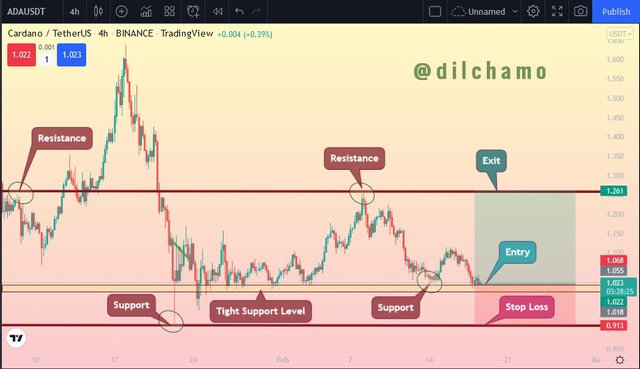
I have used the ADA/USDT cryptocurrency pair to perform a demo buy entry. First I have taken the daily timeframe to get the enry point. I have identified a tight support level. Stop-loss is marked at the support level. The exit is taken at the resistance level.
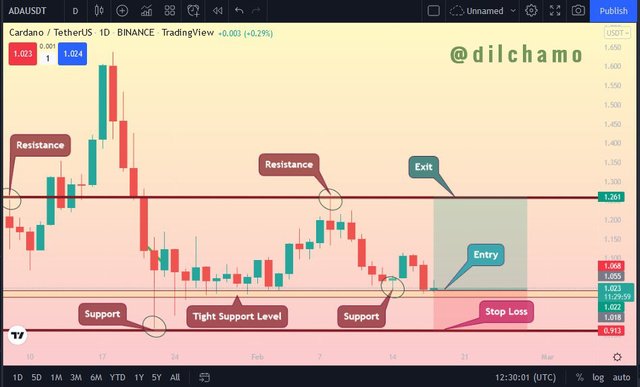
Then I changed the time frame to a 4-hour timeframe and observed the entry point. The same support and resistance levels are set in that chart as well. I could confirm the trade entry by observing the chart with a different time frame and confirming my trade.
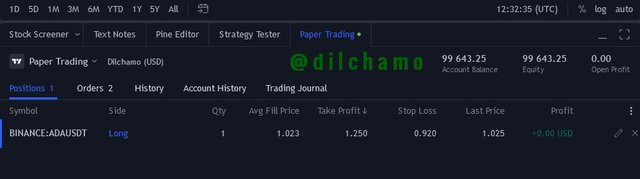
As you can see in the screenshot below I have placed my buy order from the previously confirmed entry point. From the trade, I have got a very small profit.
Conclusion
The price is an important factor to be considered when trading. When dealing with crypto assets we know that the price movement is really important as the price trends may trend upwards and downwards with time. The price action is the movement of price in a price chart with time. The traders have the ability to understand the market trends and take their trading decisions accordingly. The candlestick charts and the multiple timeframes are a good combination to spot the real-time price actions and to confirm a trade entry position. Thank you professor @reminiscence01 for this smart lesson.

Hello @dilchamo , I’m glad you participated in the 2nd week Season 6 at the Steemit Crypto Academy. Your grades in this task are as follows:
Recommendation / Feedback:
Thank you for participating in this homework task.
Thank you so much for rectifying my homework professor.