Steemit Crypto Academy Season 4 Beginners' course - Homework Post for Task 10: [Candlestick Patterns ]
Hello lovely people around glob, hope you are all doing well. Today I am submitting my homework task for beginner level, introductory coirse task 10 which is about Japanese Candlestick charts.
1a) Explin the Japanese candlestick chart? (Original screenshot required).
b) In your own words, explain why the Japanese Candlestick chart is the most used in the financial market.
c) Describe a bullish and a bearish candle. Also, explain its anatomy. (Original screenshot required)
Explin the Japanese candlestick chart? (Original screenshot required).
Japanese candlesticks are so called bcause of their origin in Japan and specifically to a rice merchant of 18th century by the name of Munehisa Homma. Japanese candlesticks represent very important Information about the price movement of an asset . They are used in stocks, commodities, forex, crypto etc. Each Candle in Japanese candlestick chart represent price movement of an asset under consideration for a specified period of time and the time period can be changed as per trading style of user. Candlesticks are colored differently in different softwares and the most common colors being green for bullish and red for bearish candle. However, these colors can also be changed. Each candle has four important price points and they are open price, close price, low price and high price. We will discuss details of each candle in subsequent section.
Different candleeticks combine to form different candlestick patterns. These candlestick patterns provide important trading signals. Some patterns are bullish and some are bearish like morning star is bullish pattern and evening star is bea4ish pattern. For name sake, other patterns are double bottom, double top, head and shoulder, wedge patterns and triangle patrerns etc. So Japanese candle sticks represent huge amount of information about an asset or security.
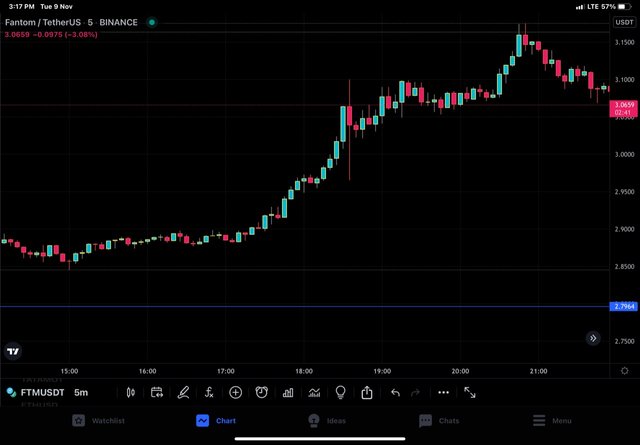
FTM/USDT Chart over 5 min time frame
In the above chart , we can see the bullish momentum in the price by just looking at the chart without going into the details of the actual price movement
In your own words, explain why the Japanese Candlestick chart is the most used in the financial market.
Of the many chart patterns like bar chart, line chart, Heikin - Ashi chart, JC chart etc, the most common type of chart pattern is Japanese Candlestick chart patrern for following reasons :
These charts are simple to understand. Without even going into details, traders can understand certain important trading parameters like trend (up or down or sideways ) , price movement at particular point by color of charts etc and these things don't require any technical knowledge.
They provide some vital data of an asset over a specific time period like open, low, close and high price.
They provide more information than other type of charts like line charts only provide closing price.
They work well on all time periods unlike Heikin Ashi that are suitable for long periods only and only identify trends.
They have been thoroughly studied and therefore various patterns have been identified that help traders predict price movement and therefore take more bold decisions.
They are supplemented by various indicators which further increase their accuracy and ease of doing trade.
Describe a bullish and a bearish candle. Also, explain its anatomy. (Original screenshot required)
Bullish candle is a type of candle which represents the price moveent of an asset over a period of time where the closing price of an asset is higher than the opening price of an asset. On the contrary, bearish candle is a type of candle where the opening prices is higher than the closing price over the specified period of time.
Anatomy of a Bullish candle
A bullish candle is usually represented by green colour, however on some softwares it is represented by white colour . Each candle weather bullish or bearish represent four price points and they are open price, close price, high price and low price of an asset for a specified period of time. A candle has a body between open and close price and shadows or wicks may be present above or below the body.
In case of a bullish candle, open price is on lower side and closing price is on upper side. If the price of an asset drops below the open price but it closes above the open price then the part of the candle below the open price will be represented by a narrow wick or shadow of the candle and the price point below the open price will form the lowest price. Similarly , if the price of an asset goes above the closing price and then comes down and close at a certain level below that price point , then the part of the candle above the closing price will be represented by a narrow wick and the upper point of the wick will represent the highest price of an asset under consideration The difference of the price between the high and low price represent the price range of a candle.
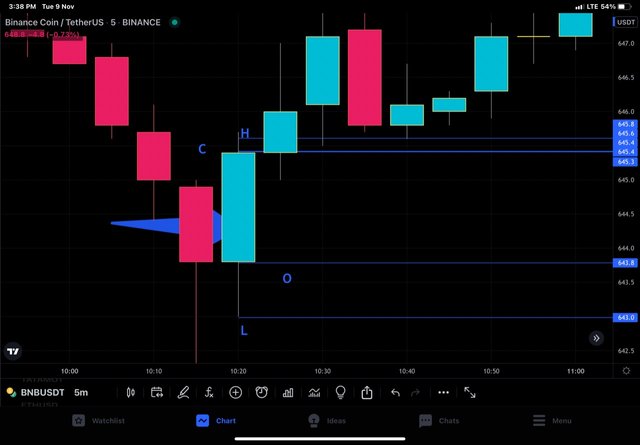
BNB/USSR chart over 5 min time frame. O= open price, H = high price, C= close price, L = low price
The open price is $643.8 and close price is $645.4. High price is 645.6 and low price is $643.
Price range is 645.6 -643 = 2.6
Anatomy of Bearish candle.
The opening price of bearish candle is on upper side and closing prices on lower side. The part of the candle between the opening and closing price is known as the body of the candle. If the price of an asset goes above the opening price but comes down and then closes somewhere down, then the part of the candle above the open price will for a wick and the upper point of the wick will be the high price. Similarly, if the price of an asset drops below the closing closing price but then closes at a certain level above the lowest point, then the part of the candle below the closing price will be represented by wick and the lowest point of the wick will be the low price of the candle.
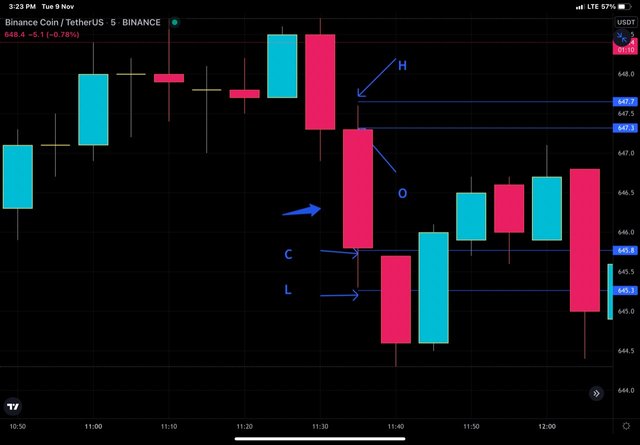
BNB/USSR chart over 5 min time frame. O= open price, H = high price, C= close price, L = low price
The open price is $647.3
and close price is $645.8. High price is 647.7and low price is $645.3
Price range is 647.7 - 645.3 = 2.4
Conclusion
Japanese candlestick charts are simple and informative tools for traders to trade in different markets. They are famous for their simplicity and diverse information that they provide. They have been thoroughly studied through decades and have became favourable chart types for traders