[REPOST] Understanding Trends II - Steemit Crypto Academy - S5W3 - Homework Post for @reminiscence01
Hello All Steemians !!!
Today I'm going to make my Steemit Crypto Academy Homework task by professor @reminiscence01 that talking about Understanding Trends II. Very interesting lessons. Actually I have very little knowledge about this, but I will try to discuss it to improve my writing skills. On this occasion I will try to discuss it.


Explain your Understanding of Trend Reversal. What is the benefit of identifying reversal patterns in the Market?
In the world of cryptocurrencies, one of the main factors a trader must do before executing a trade is to analyze market trends. Market trends change over time due to the volatile nature of cryptocurrencies. A trend reversal is a situation where the price movement of cryptocurrencies in the market begins to show a change in the opposite direction after going through a long trend. This can occur in a bullish trend and a bearish trend which will experience a trend reversal within a certain period of time. Trend reversal is very useful and profitable for traders to be able to place an exit position at the ending of the trend and to place an entry position at the beginning of the trend so that it can bring profits and minimize losses.
In this case, a trend reversal can occur in both a bullish trend and a bearish trend. It can be analyzed by traders based on price movements and market structures formed on cryptocurrency charts. A bullish to bearish reversal indicates an upward price movement that stopped creating higher highs and the strength of the trend weakens thus indicating the end of the bullish trend. This causes the price to move downwards and indicates the start of a bearish trend. On the other hand, a bearish to bullish reversal indicates a downward price movement that stopped creating a lower low and the strength of the trend weakens thus indicating the end of the bearish trend. This causes the price to move upwards and indicates the start of a bullish trend.
The trend reversal occurs inseparable from the role of buyers and sellers who control the market at a certain time. The balance of supply and demand is one of the factors that influence trend reversals to occur. When buyers control the market which shows a high volume of demand then bullish trend will occur. On the other hand, when the seller controls the market which shows a high volume of supply then bearish trend will occur. These are moments and signals that traders can take advantage of to place buy or sell orders to execute trades according to strategies that can maximize future profits and increase investment assets.
How can a fake reversal signal be avoided in the market?
In carrying out technical analysis of trend reversals in the cryptocurrency market, every trader must also be careful and consider the trading decisions that will be taken properly. This is because technical analysis and market predictions are not 100% accurate. There are times when the trend reversal analyzed is a false signal that may occur in the market. To support and improve the accuracy of the analysis, traders can use and add suitable indicators. Here traders not only predict price movements based on market patterns and structures formed on the chart, but indicators such as RSI, Bollinger Bands, EMA, ADX and others can be relied on by traders to provide more accurate results.
Here I use the RSI indicator which traders can rely on in analyzing the strength of cryptocurrency price movements and providing signals whether a trend reversal is occurring in the market. RSI is an indicator that is influenced by the strength of supply-demand by buyers and sellers within a certain period of time. RSI shows overbought and oversold momentum based on the values it shows at 70 and 30. False reversal signals can be avoided by looking at the value shown by the RSI indicator based on the cryptocurrency price movement which will confirm whether the trend is continuing or a trend reversal.
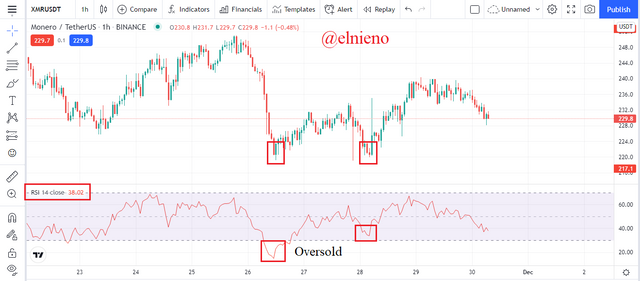
Based on the chart above, the XMR/USDT market is showing a bearish trend and the price movement is reversing. The RSI indicator is showing oversold momentum at values below 30. The XMR/USDT market is expected to reverse direction and indicate an upward price movement on overbought momentum. The upward movement of XMR/USDT price indicates a reversal signal. However this reversal is a false and invalid signal. This happened because the XMR/USDT price movement decreased again and did not reach overbought momentum. This indicates and confirms that there is no trend reversal in the market.
Break of Market Structure
Bullish to bearish trend reversal occurs when the market structure breaks out. During a bullish trend, the market structure shows upward price movement and makes higher highs and higher lows. When the price movement fails to make a new higher high and a new higher low then this is an indication of a break in the market structure in a bullish trend. This happens because buyers are unable to push prices up. This indicates the end of the bullish trend. The price movement down and breaking through the previous low is a confirmation that a bullish to bearish trend reversal has occurred in the cryptocurrency market.
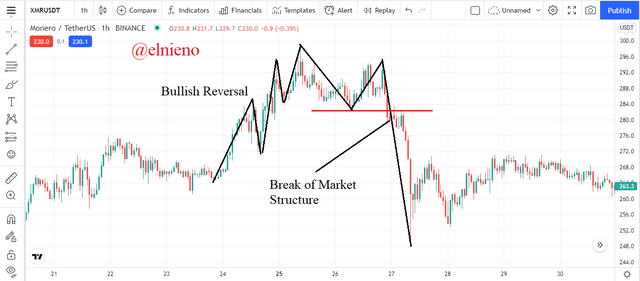
Based on the chart above, the XMR/USDT market is showing a bullish trend that makes higher highs and higher lows over a period of time. Over time, the XMR/USDT price movement decreased and failed to make a new higher high and a new higher low. The XMR/USDT market shows a break of the market structure on the chart when the price movement breaks the previous low. This is a confirmation that a bullish to bearish trend reversal has occurred in the XMR/USDT market.
Bearish to bullish trend reversal occurs when the market structure breaks out. During a bearish trend, the market structure shows downward price movement and makes lower highs and lower lows. When the price movement fails to make a new higher low and a new lower low then this is an indication of a break in the market structure in a bearish trend. This happens because sellers are unable to push prices down. This indicates the end of the bearish trend. The price movement up and breaking through the previous high is a confirmation that a bearish to bullish trend reversal has occurred in the cryptocurrency market.
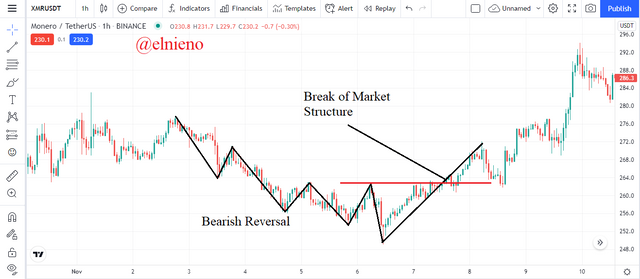
Based on the chart above, the XMR/USDT market is showing a bearish trend that makes lower highs and lower lows over a period of time. Over time, the XMR/USDT price movement increased and failed to make a new lower high and a new lower low. The XMR/USDT market shows a break of the market structure on the chart when the price movement breaks the previous high. This is a confirmation that a bearish to bullish trend reversal has occurred in the XMR/USDT market.
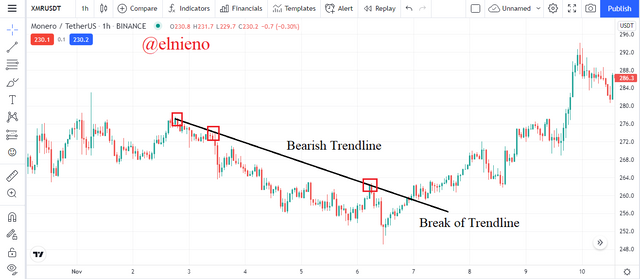
Break of Trendline
Bullish to bearish trend reversal occurs when the trendline created by traders breaks. During a bullish trend, a trendline is drawn based on an upward price movement that combines several support levels. When the price movement decreases and reverses downwards then this is an indication of a trendline break in a bullish trend. This happens because buyers are unable to push prices up. This indicates the end of the bullish trend. The price movement down and breaking through the support level is a confirmation that a bullish to bearish trend reversal has occurred in the cryptocurrency market.
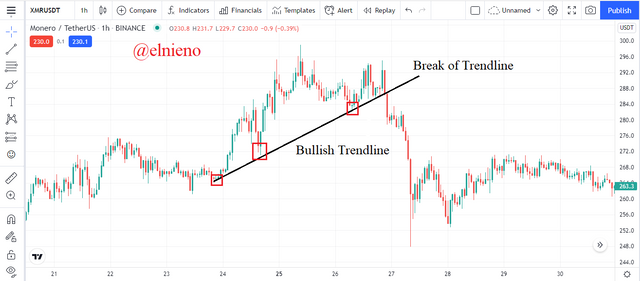
Based on the chart above, the XMR/USDT market is showing a bullish trend where the trendline is created by combining several support levels. Over time, the price movement of XMR/USDT reversed direction and showed a decrease in price. The XMR/USDT market is showing a break of trendline on the chart when the price movement breaks the support level. This is a confirmation that a bullish to bearish trend reversal has occurred in the XMR/USDT market.
Bearish to bullish trend reversal occurs when the trendline created by traders breaks. During a bearish trend, a trendline is drawn based on a udownward price movement that combines several resistance levels. When the price movement increases and reverses upwards then this is an indication of a trendline break in a bearish trend. This happens because sellers are unable to push prices down. This indicates the end of the bearish trend. The price movement up and breaking through the resistance level is a confirmation that a bearish to bullish trend reversal has occurred in the cryptocurrency market.
Based on the chart above, the XMR/USDT market is showing a bearish trend where the trendline is created by combining several resistance levels. Over time, the price movement of XMR/USDT reversed direction and showed an inrease in price. The XMR/USDT market is showing a break of trendline on the chart when the price movement breaks the resistance level. This is a confirmation that a bearish to bullish trend reversal has occurred in the XMR/USDT market.
Divergence
Bearish to bullish trend reversal occurs when the market shows a bullish divergence. Divergences occur because the price movements and technical indicators show different or conflicting results. Bullish divergence occurs when the price movement makes a lower low while the technical indicators makes a higher low. This shows conflicting results as the selling volume decreases and the buying volume begins to increase in the market. This makes the price movement shows a reversal and price increase. This divergence indicates to traders the initial potential for a bearish to bullish trend reversal in the cryptocurrency market.
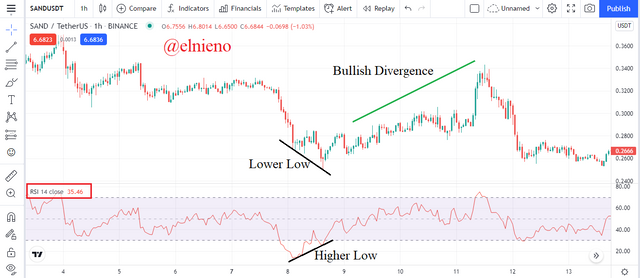
Based on the chart above, the SAND/USDT market is showing a bearish trend where the price movement made a lower low. However, the RSI indicator made a higher low based on the strength of the price movement. This shows conflicting results indicating a bullish divergence will occur in the market. Over time, the price movement of SAND/USDT reversed and showed a price increase. A bullish divergence confirms a bearish to bullish trend reversal in the SAND/USDT market.
Bullish to bearish trend reversal occurs when the market shows a bearish divergence. Divergences occur because the price movements and technical indicators show different or conflicting results. Bearish divergence occurs when the price movement makes a higher high while the technical indicators makes a lower high. This shows conflicting results as the buying volume decreases and the selling volume begins to increase in the market. This makes the price movement shows a reversal and price decrease. This divergence indicates to traders the initial potential for a bullish to bearish trend reversal in the cryptocurrency market.
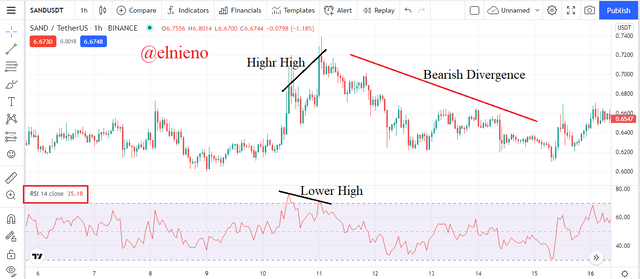
Based on the chart above, the SAND/USDT market is showing a bullish trend where the price movement made a higher high. However, the RSI indicator made a lower high based on the strength of the price movement. This shows conflicting results indicating a bearish divergence will occur in the market. Over time, the price movement of SAND/USDT reversed and showed a price decrease. A bearish divergence confirms a bullish to bearish trend reversal in the SAND/USDT market.
Double Top and Double Bottom
Bullish to bearish trend reversal occurs when the market structure shows a Double Top pattern. During a bullish trend, a double top is formed when the price movement makes a high on the first peak. After a retracement or pullback, the price movement tries to make a new high higher than the first peak but fails to reach it. This makes the price move in the opposite direction and shows a decrease in price. The double top pattern indicates the end of the bullish trend as buyers were unable to push the price up. The downward price movement confirms the bullish to bearish trend reversal has occurred in the cryptocurrency market.
The Double Top pattern must have the following criteria:
- The price movement did not break above the high point of the first peak.
- The closing price of the second peak is not higher than the highest point at the first peak.
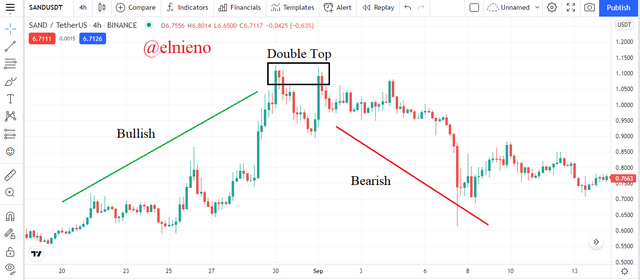
Based on the chart above, the SAND/USDT market is showing a bullish trend and forming a double top pattern on the chart. This pattern is formed based on price movements that make a high at the first peak and after a retracement, the price movements fail to make a new high higher than the first peak at the second peak. Over time, the SAND/USDT price movement reversed and showed a decrease in price which confirmed a bullish to bearish trend reversal in the SAND/USDT market.
Bearish to bullish trend reversal occurs when the market structure shows a Double Bottom pattern. During a bearish trend, a double bottom is formed when the price movement makes a low on the first peak. After a retracement or pullback, the price movement tries to make a new low lower than the first peak but fails to reach it. This makes the price move in the opposite direction and shows an increase in price. The double bottom pattern indicates the end of the bearish trend as sellers were unable to push the price down. The upward price movement confirms the bearish to bullish trend reversal has occurred in the cryptocurrency market.
The Double Bottom pattern must have the following criteria:
- The price movement did not break below the low point of the first peak.
- The closing price of the second peak is not lower than the lowest point at the first peak.
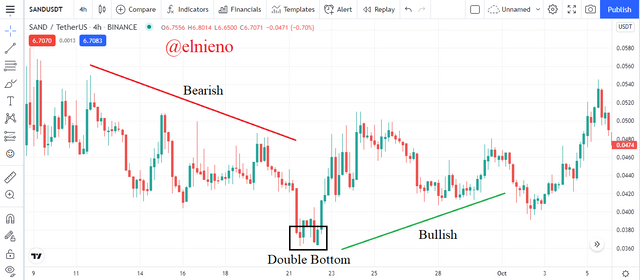
Based on the chart above, the SAND/USDT market is showing a bearish trend and forming a double bottom pattern on the chart. This pattern is formed based on price movements that make a low at the first peak and after a retracement, the price movements fail to make a new low lower than the first peak at the second peak. Over time, the SAND/USDT price movement reversed and showed an increase in price which confirmed a bearish to bullish trend reversal in the SAND/USDT market.
Place a demo trade using any crypto trading platform and enter a buy or sell position using any of the above mentioned trend reversal/continuation pattern
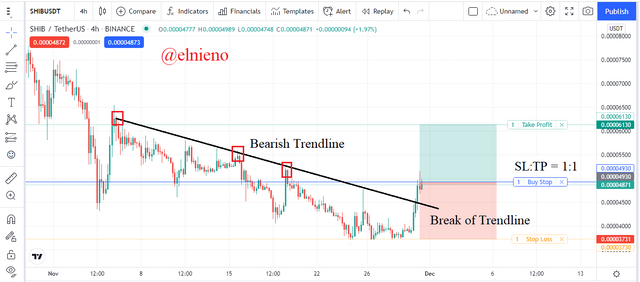
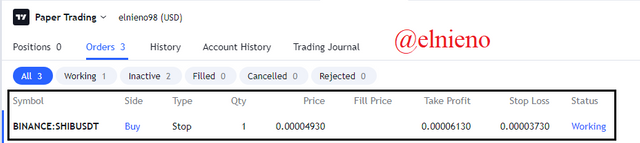
Based on the chart above, the SHIB/USDT market is showing a bearish trend and I made the trendline by combining several resistance levels. I analyze the price movement of SHIB/USDT that reversed direction and showed an inrease in price. The SHIB/USDT market is showing a break of trendline on the chart when the price movement breaks the resistance level. The confirmation that a bearish to bullish trend reversal has occurred in the SHIB/USDT market. I placed a buy order after a few bullish candles at $0.00004930. I set the stop loss level slightly below the support level at $0.00003730 and the take profit level at $0.00006130 in a 1:1 ratio. Transaction details are as follows:
Conclusion
In the world of cryptocurrency, every trader needs a strategy and technical analysis before executing a trade where market trend reversal analysis is one of them. Trend reversal analysis is very useful and profitable for traders to be able to place an exit position at the ending of the trend and to place an entry position at the beginning of the trend so that it can bring profits and minimize losses. Trend reversal analysis can be done by analyzing cryptocurrency price movements which show Break of Market Structure, Break of Trendline, Divergence and Double top and Double bottom in the cryptocurrency market.
My Previous Homework Post Link :
https://steemit.com/hive-108451/@elnieno/understanding-trends-ii-steemit-crypto-academy-s5w3-homework-post-for-reminiscence01