Trading Using Rectangle Pattern - Steemit Crypto Academy - S5W4 - Homework Post for @sachin08
Hello All Steemians !!!
Today I'm going to make my Steemit Crypto Academy Homework task by professor @sachin08 that talking about Trading Using Rectangle Pattern. Very interesting lessons. Actually I have very little knowledge about this, but I will try to discuss it to improve my writing skills. On this occasion I will try to discuss it.

Explain Rectangle Pattern in your own word
Rectangle Pattern is a technical analysis that traders can use in analyzing cryptocurrency trading charts. This patterns are formed in the market based on the price movements of cryptocurrencies which tend to be in a sideway trend. The price movement formed resistance and support points several times and only bounced at these points. Traders can draw resistance and support lines on the chart which indicates this pattern is forming in the market. This pattern can be used as a reference by traders in predicting the market and placing buy or sell orders at the right time so that traders can execute profitable trades.
Rectangle Pattern indicates the absence of a strong bullish or bearish trend in the market. The price movements within a certain period of time indicate a bullish or bearish trend both controlling the market so that it forms a sideway trend. This pattern give traders an indication of price movements that will experience a strong bullish or bearish trend in the near future. If the price movement breaks through the resistance line then this is an indication of a bullish trend that will occur because the sellers are unable to push the price down and control the market. On the other hand, if the price movement breaks through the support line, this is an indication of a bearish trend that will occur because buyers are unable to push the price up and control the market.
In this case, this pattern can be used and relied on by traders to place buy or sell orders that can bring profits and minimize losses. Traders can place buy orders when this pattern is formed in the market and the price movement breaks through the resistance line. This will benefit traders because they can place entry positions at the beginning of a bullish trend. On the other hand, traders can place a sell order when this pattern is formed in the market and the price movement breaks through the support line. This will benefit traders because they can place entry positions at the beginning of a bearish trend. This is one of the technical analysis and trading strategies that traders must do in executing trading.
How to identify Rectangles
The identification of the Rectangle Pattern can be analyzed by traders based on the candles that form on the chart that show the movement of the cryptocurrency price within a certain period of time. This pattern can be identified in the market by observing price movements that go up and down without crossing each other which indicates a sideway trend because there is no strong bullish or bearish trend. Traders can draw resistance and support lines horizontally by combining some of these resistance and support points that form in the market.
Rectangle Pattern analyzed by the trader must be based on price movements that bounce between the resistance point at the top and the support point at the bottom which can be drawn into a horizontal trend line. This trend line must have at least 2 points of resistance and support reached from each trend line. The price movement must make at least two highs indicating resistance and two lows indicating support where it should approach or reach the trend line. This pattern will provide an indication of a bullish or bearish trend after a breakout occurs in the market as shown in the following chart:
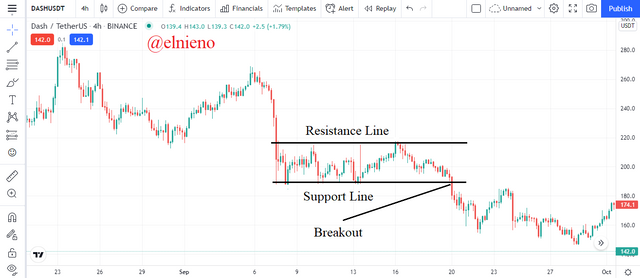
Based on the chart above, the DASH/USDT market is showing a Rectangle Pattern. Price movements create several resistance and support points within a certain period of time which can be drawn into horizontal trend lines and show the market is in a sideway trend. This happens because buyers and sellers are trying to control the market. When the price movement shows a decrease and breaks through the support line, this is a confirmation that a bearish trend has occurred in the market.
Can we use indicators with this pattern to get accurate results?
In the world of cryptocurrencies, traders can perform technical analysis in various ways and trading strategies. In addition to using existing patterns, traders can also add technical indicators to support and improve the accuracy of the analysis results. Technical indicators have an important role in providing indications and helping traders predict the market. As a reliable trader, it is only natural that the use of indicators and patterns must be applied and combined to produce successful trades. Rectangle Pattern can be combined with some suitable technical indicators such as MACD, RSI, Bollinger Bands and others. Here I use the MACD indicator to support the accuracy of the Rectangle Pattern.
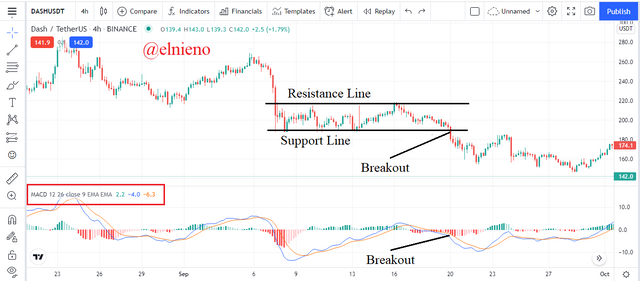
Based on the chart above, I combined the Rectangle Pattern and MACD indicator in analyzing the DASH/USDT market. The MACD indicator shows short green and red bars as long as the market is in a sideway trend and forms a Rectangle Pattern. This shows that the market has not experienced a strong bullish or bearish trend as buyers and sellers seek to control the market. Over time, the downward movement of the price and breaking the support line is an indication that a bearish trend will occur. The MACD indicator confirms by showing a long red bar followed by a significant descending EMA line. The combination of the Rectangle Pattern and the MACD indicator can provide traders with accurate analysis results.
Explain Rectangle Tops and Rectangle Bottoms in your own words
Rectangle Tops
Rectangle Tops form in the cryptocurrency market at the top of a trend or chart. This pattern is usually formed after the market has experienced a strong bullish trend and a downward price movement indicates the beginning of a trend reversal to bearish. This pattern provides an indication for traders that a bearish trend will occur after a breakout occurs in the market. This is a confirmation that traders can use as a reference to execute a trade by placing a sell order at the beginning of a bearish trend and making a profitable trade.
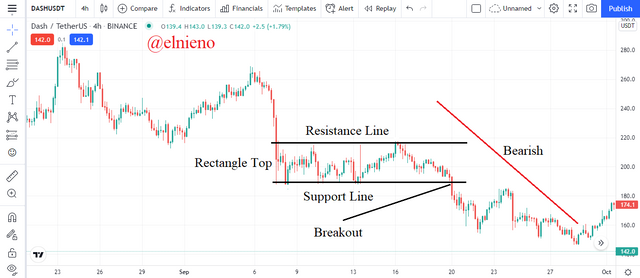
Based on the chart above, the DASH/USDT market shows a Rectangle Top forming at the top of the trend or chart. This pattern is formed based on price movements that go up and down between several support and resistance points that I have drawn into a horizontal trend line on the chart. This pattern is usually formed at the beginning of a bullish to bearish trend reversal. The price movement that tends to fall and breaks the support line is a confirmation of a bearish trend in the market.
Rectangle Bottoms
Rectangle Bottoms form in the cryptocurrency market at the bottoms of a trend or chart. This pattern is usually formed after the market has experienced a strong bearish trend and an upward price movement indicates the beginning of a trend reversal to bullish. This pattern provides an indication for traders that a bullish trend will occur after a breakout occurs in the market. This is a confirmation that traders can use as a reference to execute a trade by placing a buy order at the beginning of a bullish trend and making a profitable trade.
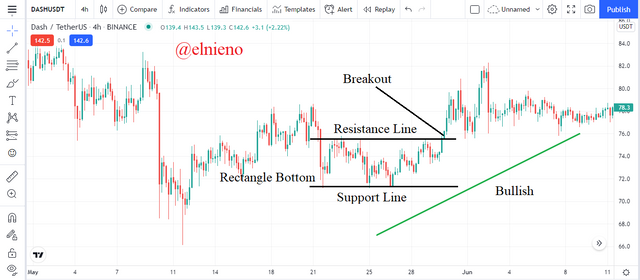
Based on the chart above, the DASH/USDT market shows a Rectangle Bottom forming at the bottoms of the trend or chart. This pattern is formed based on price movements that go up and down between several support and resistance points that I have drawn into a horizontal trend line on the chart. This pattern is usually formed at the beginning of a bearish to bullish trend reversal. The price movement that tends to rise and breaks the resistance line is a confirmation of a bullish trend in the market.
Show full trade setup using this pattern for both trends
Rectangle Tops
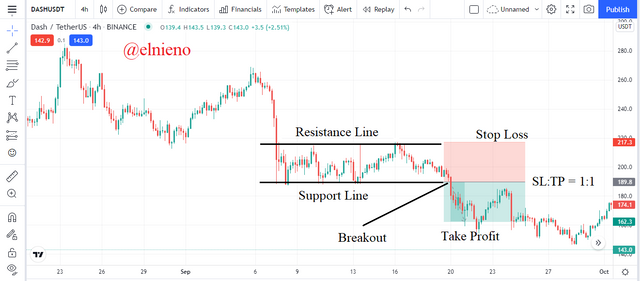
Based on the chart above, I made a trade setup based on the DASH/USDT market forming the Rectangle Top. This pattern forms at the top of a trend or chart. I analyze price movements that go up and down within a certain period of time and this shows the market is in a sideway trend. I created a trend line horizontally by combining several resistance and support points. Price movements tend to go down and break the support line. This is a confirmation of a bearish trend and it indicates me to place a sell order in the market. After the market breakout, my entry point was at $189.8. I set the stop loss level slightly above the resistance line at $217.3 and the take profit level at $162.3 in a 1:1 ratio.
Rectangle Bottoms
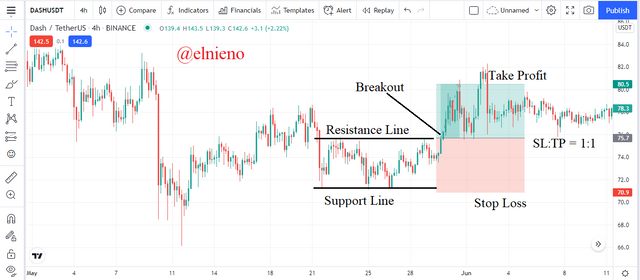
Based on the chart above, I made a trade setup based on the DASH/USDT market forming the Rectangle Bottom. This pattern forms at the bottom of a trend or chart. I analyze price movements that go up and down within a certain period of time and this shows the market is in a sideway trend. I created a trend line horizontally by combining several resistance and support points. Price movements tend to go up and break the resistance line. This is a confirmation of a bullish trend and it indicates me to place a buy order in the market. After the market breakout, my entry point was at $75.7. I set the stop loss level slightly below the support line at $70.9 and the take profit level at $80.5 in a 1:1 ratio.
Conclusion
In the world of cryptocurrencies, traders must carry out technical analysis and prepare a strategy before executing a trade. One of the technical analyzes that traders can perform is trading using the Rectangle Pattern. This pattern can help traders to predict price movements and market trends that will occur. This pattern can be analyzed and created by drawing a trend line horizontally that combines several resistance and support points when the market trend is sideway. This pattern will give an indication of a bullish or bearish trend that will occur after the market breakout. This will help traders to place buy or sell orders at the right time to maximize profits and minimize losses after executing trades.