STEEMIT CRYPTO ACADEMY-S5-W4::HOMEWORK POST FOR PROF.@sachin08 ON::TRADING USING RECTANGULAR PATTERN::
GREETINGS EVERYONEPermit me to use this opportunity to say a big thank you to God Almighty for making it possible for us all to be alive and fine and also giving us the opportunity to be part of this weeks’ homework task. And a say a big thank you to Professor @sanchin08 for this wonderful class.
INTRODUCTIONHaving the opportunity to understand the concept of trading cryptocurrencies is indeed a privilege. Going back on a memory lane, last week we had the opportunity to discuss the various triangular patterns used in trading.
Hence, having the ability to understand those concepts discussed last week will therefore give us an insight into what this weeks’ class would be. It would be important to note that all these are under the umbrella of carrying out successful trading.
.png)
[ingame edited canvas.com]
Therefore, Trading using Rectangular patterns been these weeks area of concentration would be therefore discussed in detail in the subsequent paragraphs below.

Explain Rectangle Pattern in your own word.
Before going in to discuss Rectangular patterns in detail, it would be wise to, first of all, have an understanding of what a Rectangle is. A rectangle mathematically is simply a shape with four sides opposite each other. Hence, in cryptocurrency, a rectangle here comprises two opposite angles which are named the Top and the Bottom rectangle.
[SCREENSHOT FROM TRADINGVIEW]
Generally, rectangles can be said to mean patterns that appear on a price chart of an asset. From these being said, I will continue by saying a rectangle is simply formed on the price chart of an asset when the price of these asset being traded appear to reach the same horizontal support lines and also the resistance levels of these asset multiple times. (The reason for the term horizontally simply comes in as a result that the parts of the rectangle basically applied here are the top and the bottom parts).
Basically in application to real life, just like water flows through a pipe, applying this to a price chart indicates that the rectangular structures formed on the price chart are hence between the Top horizontal level and the Flat bottom of the rectangle.
Furthermore, it is important to know that these rectangular patterns formed on the price chart of an asset simply indicate that there is no trend in the market reason being that the price is moving up and down between both the resistance and the support lines. These rectangular structures that are formed already on the chart can simply come to an end when there is a breakout in the market.
How to identify Rectangles. Explain with Screenshots.
The identification of rectangles on a price chart is something that is not usually common. Hence, the identification of the rectangle in a price chart can be characterized by two factors which are:
PRICE TREND: This is one very important thing any trader should check before entering a market. The ability to know the exact trend a market is undergoing at that particular time would give you an edge on how to go about trading. Knowing if the market is Bullish (Uptrend), whether it is Bearish (Downtrend), if there is resistance in the market, whether there is a false breakout, etc. This would therefore help you know what is the actual trend in the market.
Hence, the rectangular patterns are simply identified in a price trend through the multiple up and downtrend formed. This is to say when there is resistance in the market.
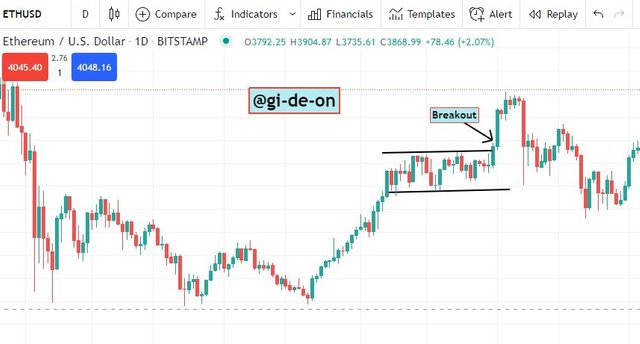
[SCREENSHOT FROM TRADINGVIEW]
From the screenshot above, you will notice that the trend that had to occur before the rectangle pattern was formed was a Bullish trend. Hence from observation, you will notice that the structure of the rectangular pattern is simply in a zig-zag form where the price tries to rise then drops back. This is to say both the resistance level and the support level have the same level of rise and fall.
HORIZONTAL TREND LINES:Here the rectangles can simply be identified when the price of the traded assets is simply having a bullish or bearish trend. Along with this trend, there is a rectangle formed alongside the trend. When the price bounces upward and then backward in the same manner at the same rate. Along the process of identifying a rectangle pattern on a chart, it would be wise to look at the chart where there are horizontal movements and hence the price at that point must bounce between the resistance level (flat top) and support line (flat bottom).
It would be wise to know that these structures formed called the rectangle, as the price moves there should be space between them in a zig-zag form showing clearly the rise and fall of the asset price at these points in the chart.
Can we use indicators with this pattern to get accurate results? Explain with Screenshots.
For me, I will say it be rather unwise to trade without any indicator. The ability to be able to combine the strategy of trading you wish to put in place without a perfect indicator to apply these strategies with I will say the trading might go successfully but there might be lack in an area that might not be visible these might likely lead to failure in the trade. Applying an indicator with a rectangular structure will surely do the trick. Hence been able to read both your indicator and the chart price of the asset would help the trader/investor trade without much stress and as well lead to successful trading.
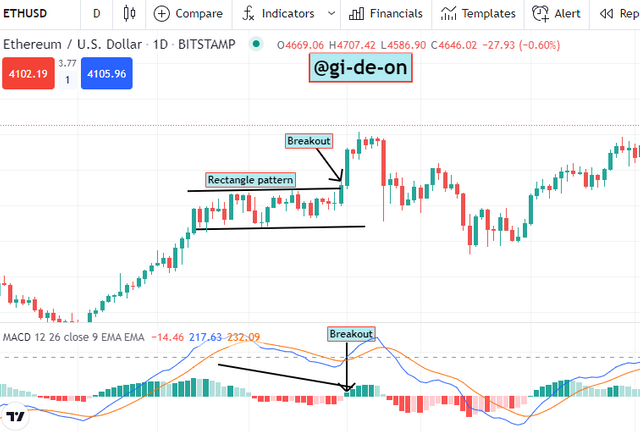
[Screensho from tradingview]
As shown in the screenshot below to justify my claim, I will be using the MACD indicator alongside the rectangular pattern. From the screenshot, you will see from the indicator more clearly that when the price of the asset downtrend is displayed properly and more visible with the RED color and shorter bars to show that have been or the market is currently experiencing a downward trend. Hence since there was a rectangular structure formed, from the indicator you iwill notice that the colors of the bars are not the same, there are others that are more redish than others.
Similarly, when the market is experiencing an uptrend the same thing happens. With the application of indicators, it would help send the direct message that is been passed by the chart/market price of the traded asset.
Explain Rectangle Tops and Rectangle Bottoms in your own words with Screenshots of both patterns.
To have a clearer picture of how to identify a rectangular top or bottom, the idea is simply to take a look at the preceding trend that happened before the occurrence of the rectangular trend.
[Rectangula Top]
There is a clear distinction between these two terms; Rectangular Tops and Rectangular Bottom. Just like the bullish and bearish trend. The Rectangular top simply happens are a result of the uptrend in the price of the traded asset while the Rectangular Bottom happens as a result of the downtrend of the traded asset.
[Rectangular Bottom]
Hence, there occur two distinctive types of trends which is bullish and bearish trends. That is to say, the rectangular top is formed at the top of the trend while the rectangular button is formed at the bottom of the trend.
Show full trade setup using this pattern for both trends. ( Entry Point, Take Profit, Stop Loss, Breakout)For the purpose of this lesson I will be setting up a trading procedure with the Entry Point, Take Profit, Stop Loss, Breakout all being displayed in the chart as shown below. This is simply done with the asset ETH/USD.
FOR BUY TRADE SETUP
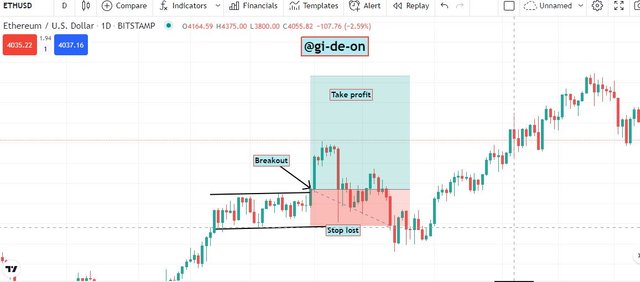
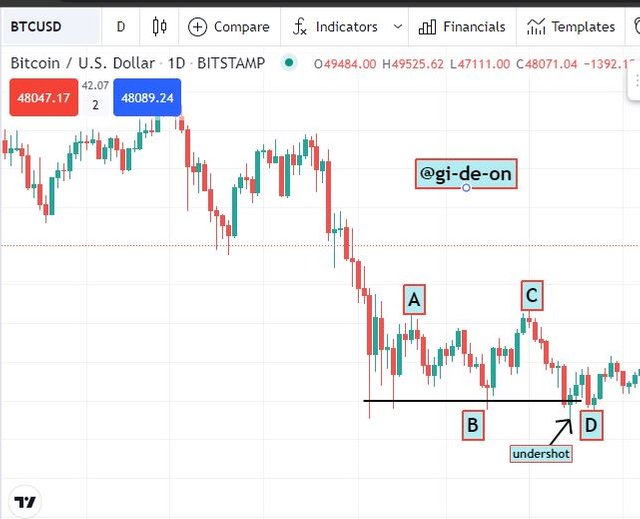
[screenshot from tradingview]
From the screenshot above, you will notice that the rectangle structure formed simply touch both horizontal lines hence, the breakout on the price chart simply became the entry point of the market. Furthermore, the take profit will be set above the resistance level and the stop loss will be just below the support line.
FRO SELL TRADE SET UP
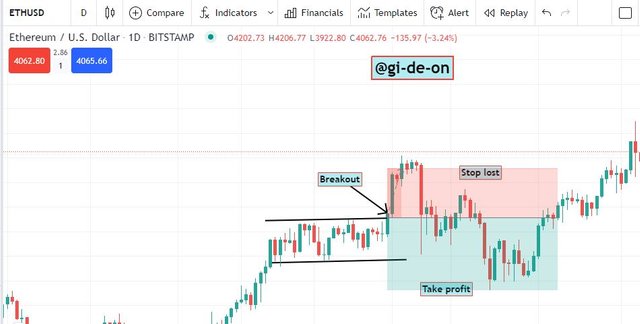
[screenshot from tradinview]
From the screenshot above, you will see that the rectangle pattern formed is touching both horizontal lines formed. The breakpoint from the chart simply indicates the entry point in the market where we set the trade for short or assets held can be sold at that point. Also, the stop loss is set a little above the resistance line and the take profit set too.
CONCLUSIONIn this weeks’ class, we have been able to discuss Rectangular patterns and how there can simply be used in the simple trader.
Hence, the application of these rectangular patterns and the suitable indicators will therefore aid in the successful trading of any asset. Hence these chart pattern can simply be found in the chart of the traded asset price.
I will conclude by saying the class was very impacting and well explained. All thanks to Prof. @sachin08 for this very lesson.
CC:@sachin08
CC:@steemcurator01
CC:@steemcurator02
All Images where taken and edited by me in tradinview and canvas