Steemit Crypto Academy Contest / S14W4 - Fibonacci Retracements
Hey everyone!
This week we are diving into something cool in the trading world Fibonacci Retracements. Its like a super helpful tool that gives us clues about where the market might go Kind of like treasure map for traders!
Imagine you are in a video game and you have this special item that shows you Secret paths and hidden treasures. Well in trading Fibonacci Retracements are a bit like that. They help us figure out where the prices might bounce back (support) or hit a roadblock (resistance). Understanding this tool is like having a cheat code for Making smarter decisions in the market.
.png)
In the next few posts I am going to break down this Fancy tool Show you how it works and share my thoughts on what it tells us when we look at specific charts. So buckle up join me in this adventure and lets see if We can uncover some market secrets together
In your own words, what are Fibonacci Retracements and what are they used for? |
|---|
Imagine you are on a treasure hunt in a video game and you have got this special tool that shows you three key spots on your map: 38.2% 50% and 61.8%. These spots are like checkpoints Where the market might take breather or change its course after a big adventure just like when you find cool area in the game to rest and plan your next moves.
Now these percentages come from a special number sequence called Fibonacci Where each number is the sum of the two before it (0 1 1 2 3 5 and so on). Traders use these percentages to predict where prices might bounce back or slow down. the 38.2% is like a moderate break 50% is a bit more significant and 61.8% is a deeper pause.
So after prices make big move we look at our treasure map (the chart) and see if it aligns with these special spots. If it does its like finding a hidden treasure chest the market might do something interesting there! Traders use these retracement levels to make smart decisions about When to join the adventure (enter a trade) or take break (exit a trade).
In simpler terms Fibonacci Retracements act like a secret code in the trading world helping traders find sweet spots on the chart where they can make well-informed decisions. It's a bit like having a cheat code for success in the trading game!
Explain the most important Fibonacci levels and show at least one example on a chart of a cryptocurrency pair |
|---|
Imagine you are on a treasure hunt in a Video game and you have got this special tool that show you three key spots on your map: 38.2% 50% and 61.8%. These spots are like checkpoints Where the market might take breather or change its Course after big adventure just like when you find cool area in the game to rest and Plan your next moves.
Now these percentages come from special number sequence called Fibonacci where each number is the sum of the two before it (0 1 1 2 3 5 and so on). Trader use these percentages to predict where prices might bounce back or slow down. the 38.2% is like a moderate break 50% is a bit more significant and 61.8% is deeper Pause.
So after prices make big move we look at our treasure map (the chart) and see if it aligns with these Special spots. If it does its like finding hidden treasure chest the market might do something interesting there! Traders use these retracement levels to make smart Decisions about When to join the adventure (enter a trade) or take break (exit a trade).
In simpler terms Fibonacci Retracements act like a secret code in the trading world helping traders find sweet spots on the chart where they can make well-informed decisions. Its a bit like having a cheat code for success in the trading game!
Use the STEEM/USDT chart and show how Fibonacci retracements work. |
|---|
Applying Fibonacci Retracements to STEEM/USDT Chart
Sure lets analyze the STEEM/USDT chart and see how Fibonacci retracement levels play out:
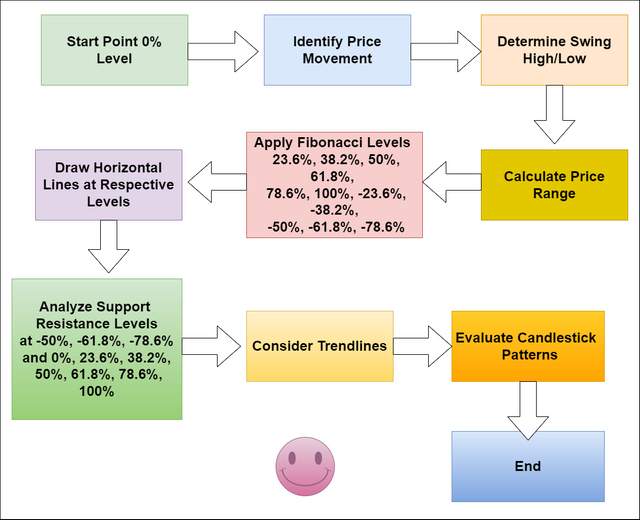
1. Choosing Swing Points:
First we need to identify Key swing points on the Chart. These points mark significant high and lows from which to draw the retracement Levels. For this example let consider the recent downward trend of STEEM/USDT:
- High: 0.4040 (marked as point A)
- Low: 0.1682 (marked as point B)
2. Drawing Retracement Levels:
With the swing points defined we can use the Fibonacci retracement tool on the chart. This will automatically calculate and draw the key retracement level (23.6% 38.2% 50% 61.8% and 78.6%) based on the selected swing point:
.png)
source
3. Interpretation and Potential Trade Signals:
Now lets analyze how price interacts with these retracement levels:
- 38.2% retracement (0.2255): Price briefly touched this level but continued its downward trend. This could indicate weak support at this level.
- 50% retracement (0.2861): Price found some significant resistance around this level potentially suggesting indecision in the market.
- 61.8% retracement (0.3467): A strong rejection occurred at this level prompting a further decline in price. This could be interpreted as a bearish signal suggesting sellers regained control and pushed the price lower.
Advantages and disadvantages of Fibonacci retracements. |
|---|
| 1. Objective Levels: Fibonacci retracement level provide traders with objective and redefined levels on a chart. This help remove some subjectivity from the analysis the levels are based on a mathematical Sequence. |
| 2. Widespread Use: Fibonacci retracements are widely used by many trader and analysts. The widespread adoption can create self fulfilling prophecies many market participants pay attention to these level potentially leading to increased buying or selling activity at these points. |
| 3. Versatility: Fibonacci retracements can be applied to various financial instruments and timeframes making them Versatile tool for trader in different market. |
| 4. Confluence with Other Indicators: When used in Conjunction with other technical analysis tools such trendlines moving averages or support and resistance levels Fibonacci retracements can enhance the Overall analysis and increase the likelihood of accurate predictions. |
| 1. Subjectivity in Swing Point Selection: The effectiveness of Fibonacci retracements relies on the correct identification of swing point. Traders may have different opinions on where these points Should be Placed Leading to variations in the retracement levels drawn. |
| 2. Not Foolproof: While Fibonacci retracements can Provide valuable insights they are Not foolproof predictors of market movements. Traders should avoid relying Solely on these levels and Consider them as part of a comprehensive analysis. |
| 3. Self-Fulfilling Prophecies Can Lead to Overcrowding: The fact that many traders use Fibonacci retracements can sometimes lead to overcrowded trades at these levels. This can result in increased market volatility and potentially erratic price movements. |
| 4. Market Conditions Matter: In trending markets Fibonacci retracements might be more effective but in Choppy or sideways markets reliance on these levels alone may lead to false signal and poor trading decisions. |
| 5. Doesn't Account for External Factors: Fibonacci retracements don't take into account external factors Such as economic events news releases or fundamental changes in the market. Traders Should complement Fibonacci analysis with an awareness of broader market conditions. |
Great analogy! It's like having checkpoints on a treasure hunt in a video game. The Fibonacci percentages act as key spots where the market might take a breather or change its course, just like finding cool areas in the game to rest and plan your next moves.
The connection to the Fibonacci sequence adds a fascinating layer to how traders predict potential bounce-back or slowdown points. The 38.2%, 50%, and 61.8% checkpoints indeed represent different levels of pause, making it a strategic tool for traders. Well captured!
I have also participated in the contest, do well to check it out and engage. My post link to the contest.
This post has been supported through the account Steemcurator06 for containing good quality content.
Curated by : @ridwant
Nice explanation about Fibonacci retracements from you my friend. Fibonacci retracements tool help us to focast the market very well.
Thank you so much for the feedback
Greetings friend,
You've shared your thoughts and explained Fibonacci retracements in a way that's easy to understand. You've talked about the important levels of Fibonacci retracements and discussed the good and not-so-good sides of using the Fibonacci retracements indicator. Overall, you've put in a lot of effort to answer all the questions. Well done.
Thank you so much for your kind words! I'm thrilled to hear that my explanation of Fibonacci retracements was clear and easy to understand. It's always my goal to provide helpful and comprehensive information. I appreciate that you noticed the effort I put into discussing both the strengths and limitations of the Fibonacci retracements indicator
Upvoted. Thank You for sending some of your rewards to @null. It will make Steem stronger.
Greetings...
You have done well by giving a full overall explanation on the Fibonacci retracements abnd how it works on the various charts. You greatly answered the questions for this topic..
Your thoughts on the tool of Fibonacci retracements is very simple and easy to understand. The Fibonacci retracements are one of the best tools that is been used in the market space today by traders to determine entry and exit points.... It's just one of the major as well s best instruments used by various stock market participants to predict potential future stock price movements and points of entry and exit.
The FB retracements is truly like a special tool that helps you get three key spots on your map when you're on a treasure hunt in a video game....
You gave a clear view and description of how an FB retracements will work on a cryptocurrency pair. It would have been nice to see an image to represent that... Nevertheless, it's much Very Okay...
Thanks for sharing and good luck with the challenge......
Hiciste una buena analogía del tesoro en un video juego para explicar los diferentes niveles de Fibonacci, lo cual facilita la comprensión de cualquier persona.
Me parece interesante lo indicado como una desventaja en la cual señala que los retrocesos de Fibonacci no tienen en cuenta factores externos que pueden influir en la tendencia en un determinado momento.
Esto significa que no es un método infalible y el análisis técnico requiere enriquecerse con el conocimiento de las condiciones más amplias del mercado.
Has abarcado las pautas del desafío para dar respuesta a cada una de ellas.
Gracias por participar y compartir.
¡Saludos y éxitos!
Hey friend, It's an honour going through your post today.
Please technical analysis too has proven to be good in so many aspects but this Saturday does not work in accordance with external factors like trading news, new investors etc. so therefore continue to be a big downside for the strategy This is because whoever uses this strategy whenever external factors high in play old get wrong signal.
Thanks for sharing wishing you success please engage on my entry.https://steemit.com/hive-108451/@starrchris/steemit-crypto-academy-contest-s14w4-fibonacci-retracements
Greetings, my friend @hamzayousafzai!
Your opinion about Fibonacci Retracements is exceptional, simplifying complex trading tools for everyone.
Your dedication to sharing quality insights is commendable. Keep enlightening us! All the best in the contest, success for you! 👍🌟👏