Crypto Academy Season 4 Beginners' course - Homework Post for Task 10: [The Japanese Candlestick]
Introduction
Greetings to all the good members of this community. And to the professor in charge of this class, I say a big well-done. Am here with my beginners' task 10, it is my pleasure to be part of the academy.
Homework Post Question 1
1a) Explain the Japanese candlestick chart? (Original screenshot required).
b) In your own words, explain why the Japanese Candlestick chart is the most used in the financial market.
c) Describe a bullish and a bearish candle. Also, explain its anatomy. (Original screenshot required)
What is Japanese Candlestick
The Japanese Candlestick was develop around the year 1700s by a rice seller called Homma. He developed the Candlestick pattern to show the relationship and changes between the price and demand of rice during his days.
Japanese Candlestick is emotional base chart as it was developed base on the emotional representations of traders in the market. The Japanese Candlestick are purposely used by most traders to trace or predict the trend of the market and at the end make a concrete decision of either to buy or sell product, stock coin or token.
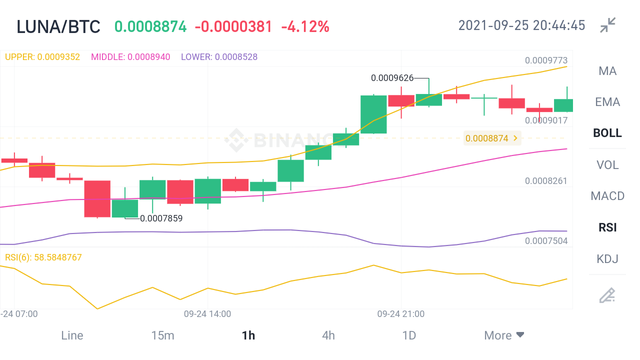
While the green Colour candlestick represent an increase in price the red colour represent drop or low price.
Why the Japanese Candlestick is the most used in the financial markets
There is no doubt, the Japanese Candlestick is the most popular chart used by most actors in the financial markets, there are various reasons for this, some of this reasons are:
- It represent human behavior during the market frame: unlike most other chart that gives the price, Japanese Candlestick show some other human behavior like entry and closing point, the upper and lower shadow etc. All these has their own interpretation of individual and market behavior.
- Easy to Understand: Japanese Candlestick is one of the most easiest chart to understand, this is one of the reasons why most people (traders) prefer to use it.
- It makes trading much easier: since it is easy to understand, then it makes trading much easier for most traders. It can also be used together with some indicators to decide a trade.
- It can be used to generate signal or predict the market trend The full knowledge of the reading of candlestick helps to generate solid signals for next trade, trader also have the benefits of studying the past chart and determine the corresponding outcome.
What is a bullish and a bearish candle.
The Bullish Candlestick
The Bullish Candlestick is a green candlestick formation which indicates an increase in coin or commodity price. A bullish candle forms when the closing of the current candle is higher than the closing of the previous candle stick.
The anatomy of a Bullish Candlestick
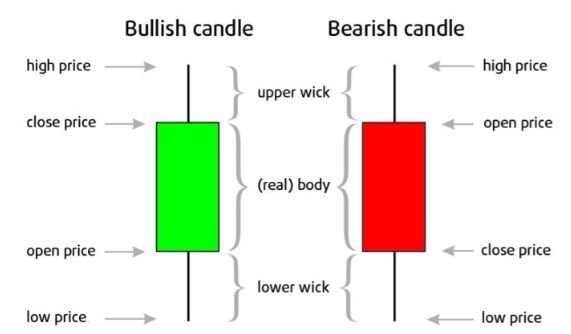
The Bearish Candlestick
The Bearish Candlestick is a red candlestick formation which indicates a decrease in coin or commodity price. A bearish candle forms when the closing of the current candle is lower than the closing of the previous candle stick.
The anatomy of a bearish Candlestick
A Bearish Candlestick has the following part
- High: this is the highest bull trend or highest point the price goes during the formation of a candle.
- Close: This is the closing point of a Bullish Candlestick. It is the down part of the real Body, It indicates where the next candle begins.
- Open: This is where the formation of the candle begins, it is in most cases the closing of the previous candle.
- Low This indicate the lowest movement of the price during the formation period, it is the tip of the lower shadow.
- Real Body: This represent the different between the opening point and the closing point of the coin or token within the time frame.
- Upper Shadow: This indicate how long the price move up before reversal during the formation of the candle.
- Lower Shadow: This indicate how long the market moves down during the formation of the candle.
Conclusion
Japanese Candlestick for years has been helpful to most traders. This class had also widen my knowledge of the Japanese Candlestick. Thanks to the professor for this class.