TRIX Indicator - Crypto Academy /S6W3-Homework Post for kouba01

Q.1. Discuss in your own words Trix as a trading indicator and how it works
Trading indicators are an essential part of technical analysis. They give the trader an insight into the behavioral patterns of prices with regards to momentum, direction, etc. Some of these indicators like moving averages smoothens out the fluctuations in price to give a clearer visual representation of price movements.
To enhance the effect of moving averages, some moving averages add weights to their calculations. They consider the most recent prices to be more significant than the previous ones. These moving averages like the Exponential Moving Average (EMA), give better insight to price movements. The weight of the EMA however, makes it very susceptible to price fluctuations as it responds more quickly to current price changes.
This susceptibility to current price changes affects the quality of signals generated by this Moving Average as it can sometimes gibe some false or incorrect signals due to being very responsive to price fluctuations.
To address this issue, a more complex Moving Average exists. The Triple Exponential Average (TRIX) employs a complex calculation in it's formula which involves triple exponential averaging. With this, it gives an indicator that smoothens out false signals. This complex formula executes a triple smoothing of exponential moving averages to filter out insignificant price movements.
HOW DOES THE TRIX WORK?
Trix indicator has a similarity with exponential moving average in the sense that it draws a line representing price trends on a chart. Trix indicator however is placed under the price unlike the EMA which is dream to overlap prices.
Nevertheless, like the EMA, Trix gives a better visual representation of price trend than the candlesticks. It follows a more linear path than even the EMA. While the EMA betters the SMA (Simple Moving Average) because it does pay more attention to most recent prices thereby reducing the lag, EMA is susceptible to responding to dubious swings in price movements which can lead to false signals.
Trix improves on the shortcomings of the EMA while maintaining it's advantages over SMA. It improves on the method of calculation with a triple smoothing of the EMA. The Trix thus becomes less lagging than the SMA and more reliable than the EMA.
It plots below the price and acts as a good confirmation and for correction of signals and price predictions though it falls short if used in isolation to deduce entry and exit signals.
Q.2. Show how one can calculate the value of this indicator by giving a graphically justified example? how to configure it and is it advisable to change its default setting? (Screenshot required)
Trix is calculated by using price to calculate an EMA, then using the EMA instead of price to calculate another EMA. This second EMA is then used to calculate a third EMA. In other words, Trix is an EMA of an EMA of an EMA. The formula for calculating Trix is given below:
TRIX = (EMA3(t) - EMA3(t-1)) ÷ (EMA3(t-1))
Where:
EMA3 = EMA(EMA2)
EMA2 = EMA(EMA1)
EMA1 = EMA(C.C.P.)
C.C.P. = Current closing price
Recall that an ordinary EMA is a weighted average that considers most recent prices as more significant. It is therefore less lagging than SMA but susceptible to responding to misleading price swings. An ordinary EMA only smoothens price though it can give some misleading responses due to misleading swings in price. Based on this, an ordinary EMA can be called a single smoothing EMA.
To address the issue of responding to misleading price swings, we need to also smoothen the EMA. To do this, we calculate the EMA of the ordinary or single smoothing EMA. This gives a double smoothing EMA (it smoothens an EMA that smoothens price).
We can take smoothing up a notch by calculating the EMA of the double smoothing EMA. This gives a triple smoothing EMA.
All these EMAs are put into the above formula to give the TRIX.
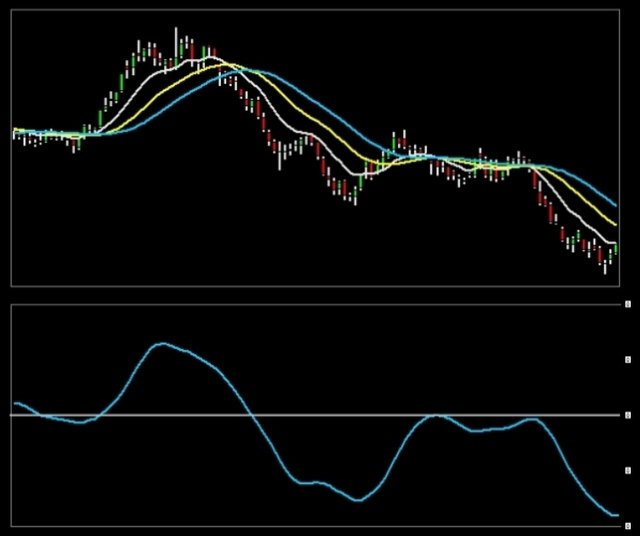
Consider the different EMAs and the TRIX in the charts image below:
The pale white lime is the single smoothing EMA, the yellow line is the double smoothing EMA and the blue line is the triple smoothing EMA. They're all EMAs of 11-periods.
src
From the image above, we see that the EMAs are exhibiting different responses to price swings. The single smoothing EMA only smoothens price as is the most responsive while the double smoothing EMA smoothens the first and is less responsive. The Triple smoothing EMA smoothens the double smoothing EMA and is the least responsive of the three.
On the lower chart, we see a more flattened TRIX. This eliminates almost every misleading swing in price movements. It's smoothens so much that it's hardly ever ideal for market entry and exit signals.
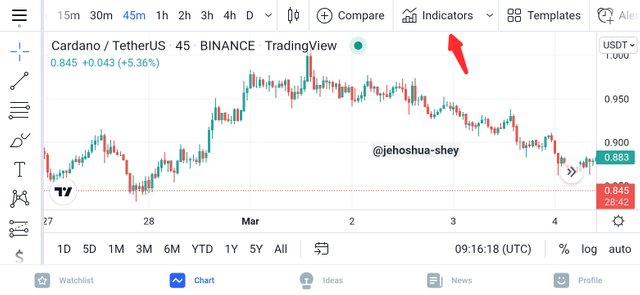
ADDING TRIX TO THE CHART
To add TRIX to a chart, simply select the chart pair to open the chart and click on the indicator icon.
Next, type 'TRIX' in the search box and select the option as shown in the image below
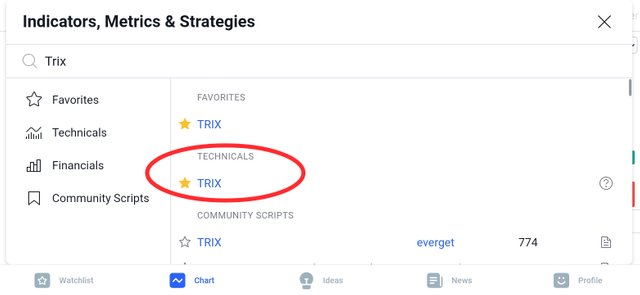
The TRIX indicator is successfully added after that.
HOW TO CONFIGURE THE TRIX INDICATOR
Click on the indicator title on the indicator chart below the price.
Next click on the settings icon to open the settings dialog box
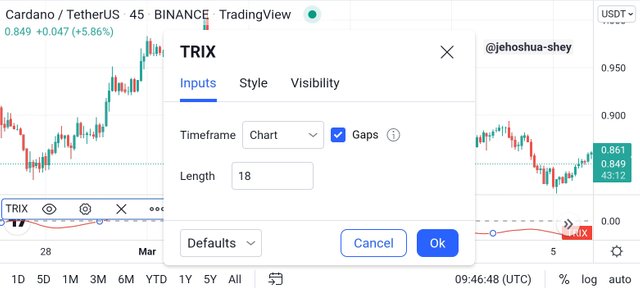
SHOULD YOU CHANGE THE INDICATOR SETTINGS?
The main setting there is the period, this determines how many periods will be considered in the averaging of price. The longer this period is, the more flattened the indicator will be and the less signals it will generate and the less chance of generating false signals. Inversely, the shorter the period, the more signals the indicator will generate and this more chance of generating false signals.
Therefore it depends on the trader's experience. For starters, stick with the default period and begin to learn from there. More experienced traders can alter the period to suit their trading style. This is because they would have learned to filter signals through confluence trading.
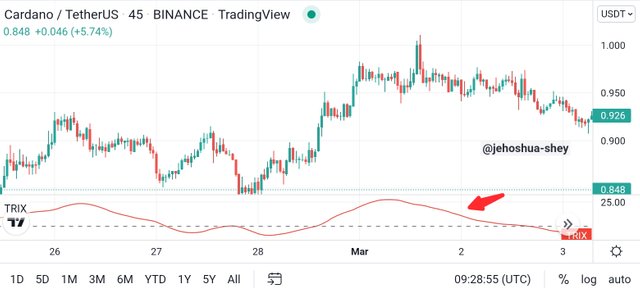
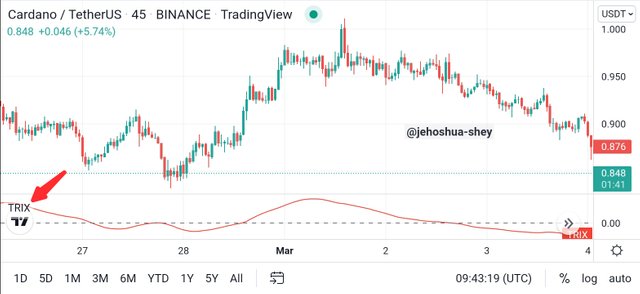
Q.3. Based on the use of the Trix indicator, how can one predict whether the trend will be bullish or bearish and determine the buy/sell points in the short term and show its limits in the medium and long term. (screenshot required)
When using the TRIX indicator, the position of the indicator with respect to the zero line tells the trend. When the indicator is above the zero line, it indicates an uptrend. On the other hand, when the indicator is below the zero line it indicates a downtrend.
Consider the images below for more comprehension:
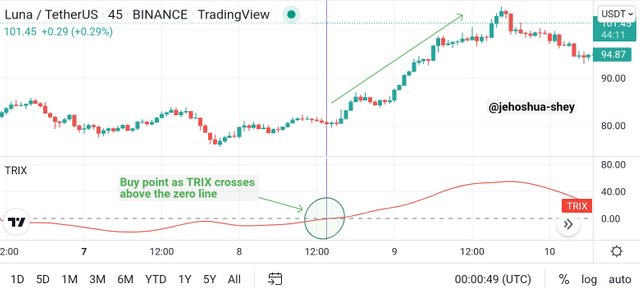
BULLISH OR UPTREND
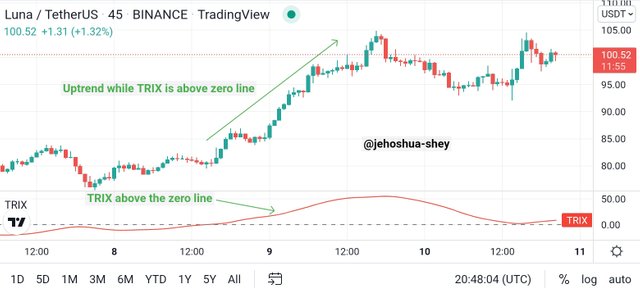
The image above is a screenshot of the 45 mins timeframe of the LUNA/USDT pair on Tradingview. From the screenshot above, we see that the TRIX crosses over the zero line and the price makes a bull run. Thus confirming the indication earlier stated.
BEARISH OR DOWNTREND
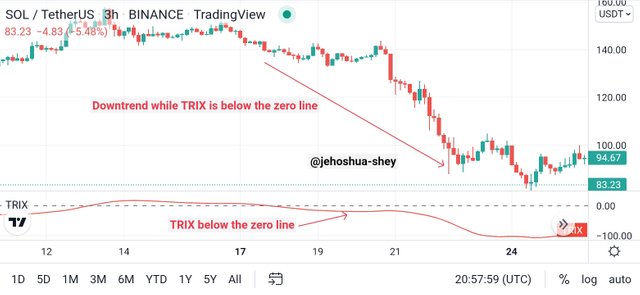
The image above is a screenshot of the 3 hr timeframe of the SOL/USDT pair on Tradingview. From the screenshot above, we see that the TRIX crosses below the zero line and the price dips. Thus confirming the indication earlier stated.
BUYING AND SELLING POINTS
A buying point is formed when the TRIX indicator crosses above the zero line. Let's consider the LUNA/USDT example to see the buying point.
The point circled in the image above is where the TRIX indicator crosses above the zero line. We can see an UPTREND from then on, showing the validity of that buy point.
A Selling point is formed when the TRIX indicator crosses below the zero line. Let's also consider the SOL/USDT example we saw earlier, to see the selling point.
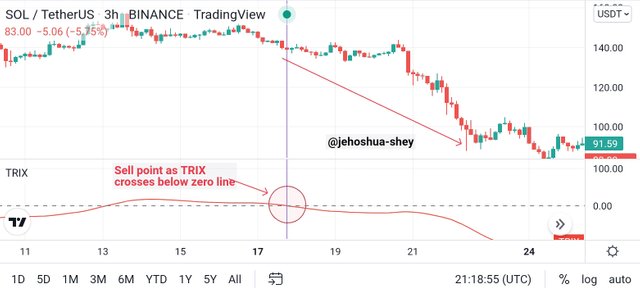
The point circled in the image above is where the TRIX indicator crosses below the zero line. We can see an DOWNTREND from then on, showing the validity of that sell point.
LIMITS OF THE TRIX INDICATOR
The examples shown earlier might seem rather valid and straight forward but it's not always like that with the TRIX indicator. Recall that we earlier said this indicator was a triple smoothened indicator and as such, responds last to price fluctuations.
In the medium and long term, during a run, this indicator might as well be obsolete when it comes to catching corrections.
In a bull run, the TRIX indicator is limited to showing the general upward trend of the price during that period. It misses the downward corrections that usually characterizes an uptrend. Consider the LUNA/USDT example again:
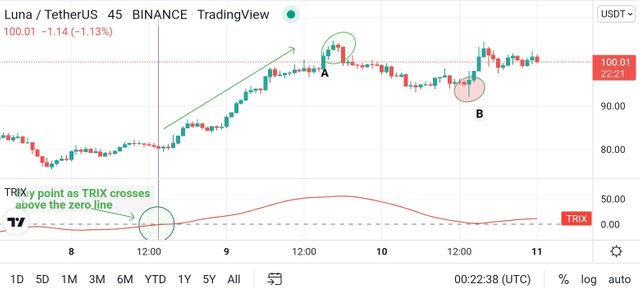
From the chart above, we see the correction made from about $104 to $93 from point A on the chart to point B. This is a 10% correction in price and with a leverage of 5x a good 50% to be made from a sell trade but the TRIX indicator made no move below the zero line to indicate a sell point.
The upside to this is that for hodlers or long term traders, it hints them that the uptrend is still on.
Q.4. By comparing the Trix indicator with the MACD indicator, show the usefulness of pairing it with the EMA indicator by highlighting the different signals of this combination. (screenshot required)
The TRIX alone is very reluctant when it comes to giving trading signals. However, when combine with another moving average indicator, it gives a lot more valid signals. This other moving average will act as the signal line in an MACD and an EMA is better suited for this role.
The fact that more signals are on display doesn't make a combination of the TRIX and a signal line predict like an erratic fortune teller, especially when this signal line is an EMA as fast as 9 periods. This is fact when compared to the MACD. The combo of TRIX and a 9 period EMA gives a smoothing terrain than the rampant MACD.
Let's still consider the LUNA/USDT chart again and show the difference between the TRIX paired with an EMA and the MACD.
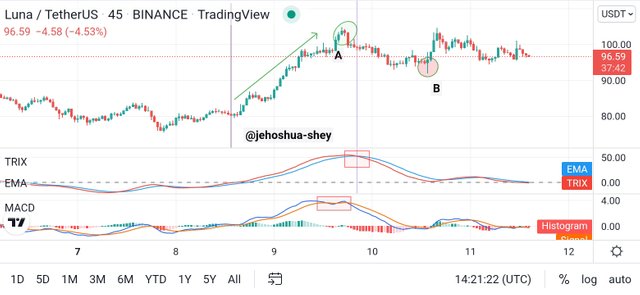
From the screenshot above, we see a smooth plot just below the price chart. This is the TRIX paired with an EMA. Below it is a more zigzag plot that is the MACD.
Remember the instance we have earlier where the TRIX failed to give a signal for a 10% correction? Well, from the chart above, we see that the TRIX crosses below the EMA (signal line) indicating a sell entry. From that point to the bottom of the correction is approximately 7% gains in sell trades (i.e. from $99.2 to $92.2).
The more erratic MACD gives a misleading entry and exit signal before the correction even begins although it ended up giving a sell entry signal much earlier than the TRIX-EMA pair. By then however, the trader would have been very well confused.
This clearly spells the difference between the TRIX paired with an EMA and the MACD.
SIGNALS FROM THE TRIX INDICATOR PAIRED WITH THE EMA.
Reading signals from the TRIX-EMA pair is quite simple. When the TRIX indicator crosses below the EMA, it signals a sell trade entry. For a confirmation, both TRIX and EMA should go below the zero line. Consider the SOL/USDT chart below:
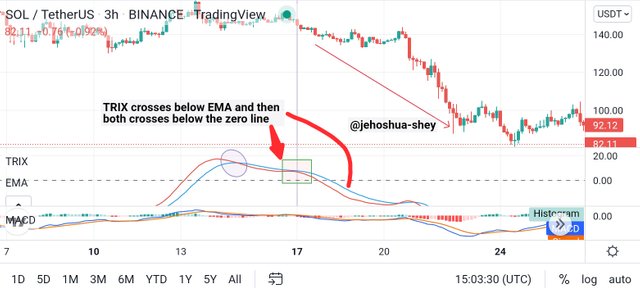
From the chart above, we first see a misleading signal on the TRIX-EMA pair then a cross of the TRIX indicator below the EMA. Both later cross below the zero line and we see a steep down trend in price during this period.
On the other hand, when the TRIX indicator crosses above the EMA, it signals a buy trade entry. For a confirmation, both TRIX and EMA should go above the zero line. Consider the LUNA/USDT chart below
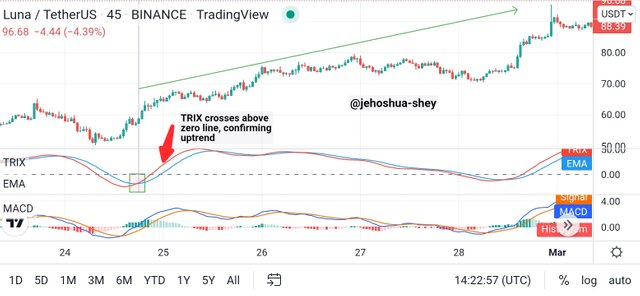
From the chart above, we see the TRIX indicator cross above the EMA and both later crossing above the zero line. The price proceeds in an uptrend during this period.
Q.5. Interpret how the combination of zero line cutoff and divergences makes Trix operationally very strong.(screenshot required)
Earlier, we saw how the cross of the TRIX and the EMA above the zero line confirmed a bullish or uptrend especially when preceded by a cross of the TRIX above the EMA. This crossing above the zero line is even more potent when it follows a bullish divergence. This is also true for the TRIX crossing below the zero line when it follows a bearish divergence.
Consider the chart below to see how the combination of divergence, signal line crossing and zero line crossing
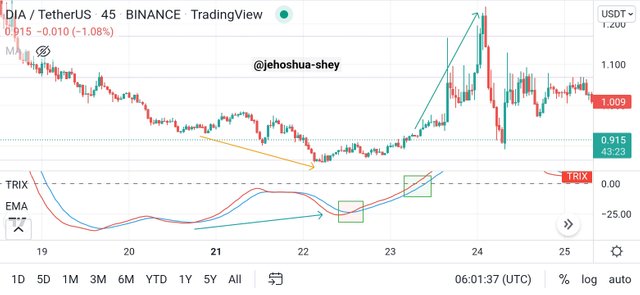
The chart above is a DIA/USDT 45 mins chart. It comprises a combination of all three incidents making one very strong signal.
From left to right, first we see a divergence. The price is making a lower low but the TRIX indicator is making a higher low. Next we see the TRIX indicator crossing above the EMA. Shortly after, both TRIX and EMA cross above the zero line. The result is a very steep uptrend as we can see from the chart.
Thus, combining zero line crossing, signal line crossing and divergence makes the TRIX operationally very strong.
Q.6. Is it necessary to pair another indicator for this indicator to work better as a filter and help eliminate false signals? Give an example (indicator) to support your answer. (screenshot required)
Yes. Fact is, you are at risk of entering late into trades if you use only the TRIX indicator. This indicator doesn't show entries early enough, so it's better to combine it with other indicators.
Personally, I'm obsessed with crossovers and since I like getting the signal early enough, I mean trix is late already, I prefer to use the TEMA crossover. This involves two TEMA indicators with different periods. With this, I can get earlier signals and use the trix to know when the signal is likely to end.
Below, I show these combination in action on a DIA/USDT 45 mins chart.
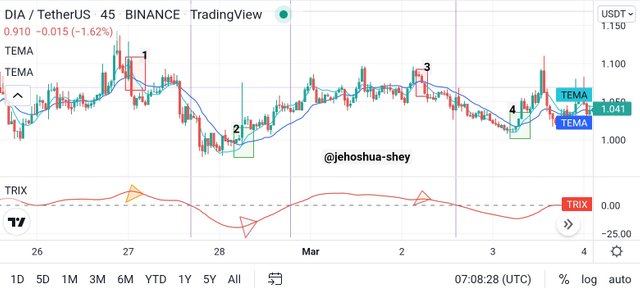
From the chart above, we see the TEMA indicators giving entry signals way earlier than the TRIX indicator. By the time the TRIX indicator gives it's signals, much water 🌊 has passed under the bridge. The TEMA indicators also give exit signals way earlier than the TRIX indicator whose signals come much later.
The signals given are numbered 1-4. The first is a sell entry signal and the second is a sell exit signal of the first or an independent buy entry signal. The third is a buy exit signal of the second or an independent sell entry signal. The fourth is a sell exit signal of the third or an independent buy entry signal.
In all, we see the TRIX indicator giving signals (the faint purple vertical lines) much later. With the combination of the TRIX indicator and TEMA indicators, we can get earlier and more profitable signals. The TRIX indicator kind of helps us to continue in our current trade until an exit signal is produced by the TEMA indicators.
Q.7. List the pros and cons of the Trix indicator
TRIX indicator has its advantages and disadvantages. They are listed below:
ADVANTAGES
TRIX indicator filters out fluctuations in price. This is usually referred to as market noise. It helps the trader get a better visual on price movement barring the frequent spikes in prices.
Because it filters market noise, it can be used to visualize the broader market trend, to help the trader plan their trading aright.
TRIX shows divergences which are very handy when trading reversals.
It is just as effective across multiple timeframes.
DISADVANTAGES
TRIX gives late signals. Many times, the signals given by the TRIX indicator are late this the profit is usually little if any.
TRIX indicator is not suitable to be used as a standalone indicator. Not like any indicator should be used as such but trix is unbearably dependent. Without being used in combination, trix almost gives no prompt signals. Lots of opportunities would be missed.
Conclusion
In conclusion, the TRIX indicator is a very important tool on technical analysis. It smoothens price and filters out market noise. This however makes it lag so bad that it's best for giving late signals. However, it thrives in combinations.
When combined with an EMA, it can give very useful cutoffs. Also, crossing the zero line after an EMA cutoff serves as a confirmation. It can also be used with two TEMAs. This gives earlier signals than the TRIX. TRIX also has divergences that can be very handy signals during market reversals.
Thanks for reading.
