Crypto Academy / Season 3 / Week 8 - Homework Post for @cryptokraze - Trading Sharkfin Pattern
Hello everyone. Our world has been fighting a big epidemic for almost 2 years. I hope all of you are in good health. Stay healthy!
Today I will share with you the my homework given by the professor @cryptokraze

1-)What is your understanding of Sharkfin Patterns. Give Examples (Clear Charts Needed)
In the cryptocurrency market, there are sudden uptrends as well as downtrends. Trading in these sudden market movements involves risk. However, in these market movements, profit can be made by following the right strategies.
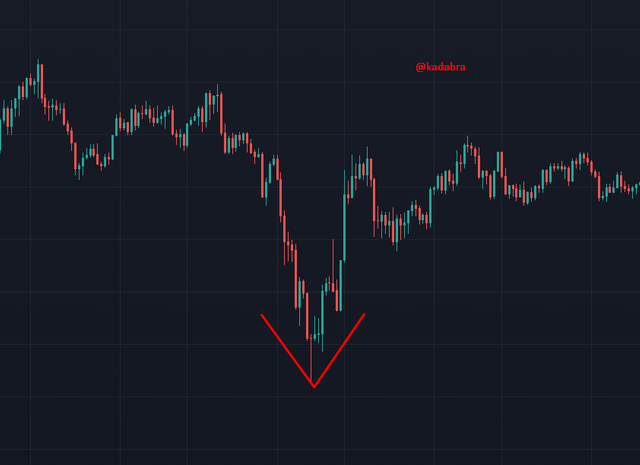
The Sharkfin pattern can be encountered in these market situations and we can use this pattern to make a profit. In the Sharkfin pattern, a V-shaped structure is formed on the graph.
When the cryptocurrency market is in a downtrend in sudden changes, the market starts to move upwards. A structure in the form of the letter V is formed on the graph. It indicates an uptrend when a flat V-shaped structure is formed on the chart.
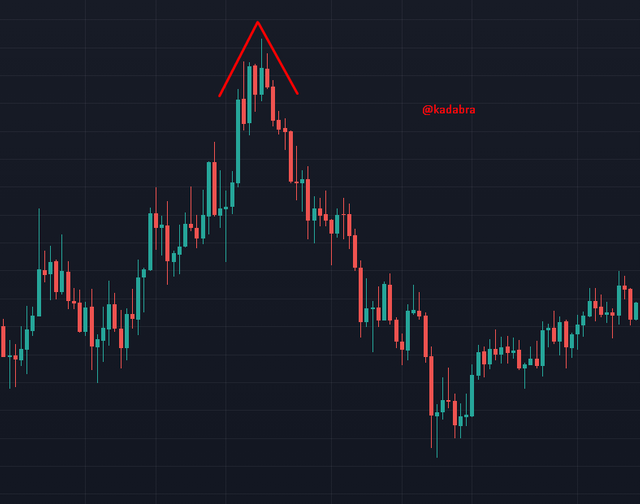
When the cryptocurrency market is in an uptrend in sudden changes, the market starts to move down. An inverted V-shaped structure is formed on the graph. This inverted V-shaped structure on the chart represents a downtrend.

2-)Implement RSI indicator to spot sharkfin patterns. (Clear Charts Needed)
RSI is one of the most used oscillators. As you know, the RSI oscillator is generally based on 30-70 levels. The 30 and below is the oversold and the 70 and above is the oversold. It can also be used in harmony with the Sharkfin pattern.
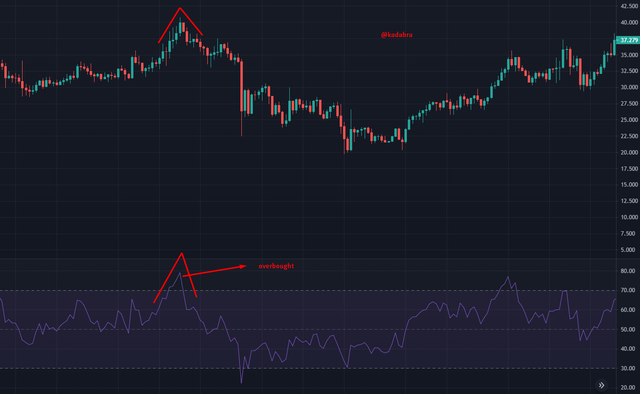
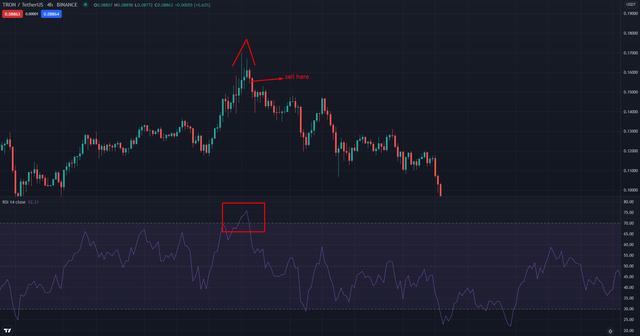
As can be seen in the chart below, an uptrend has been entered and the RSI level is in the overbought region, almost reaching the 80 level zones. Then the downtrend started and an inverted V shape sharkfin pattern was formed.
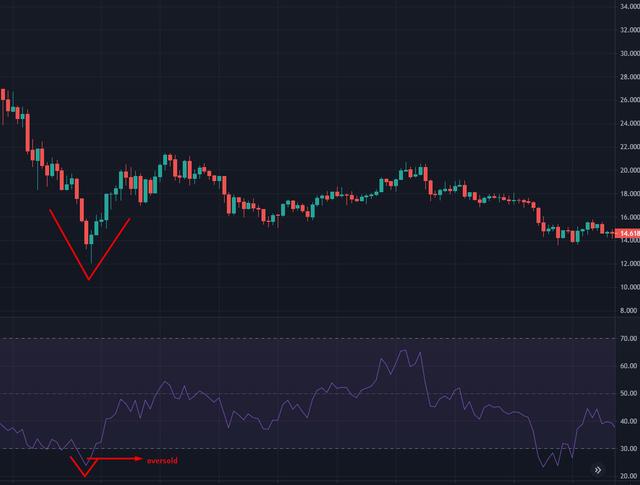
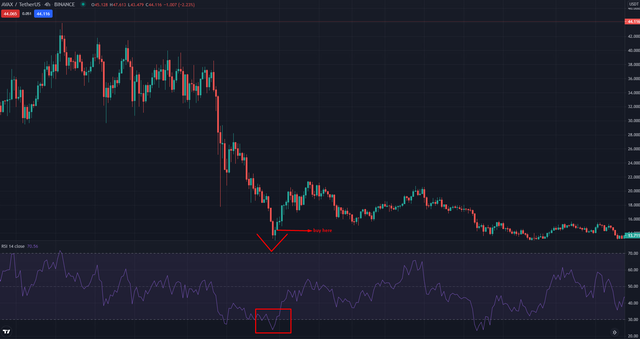
In this chart, on the contrary to the situation above, the market has entered a downtrend and entered the oversold zone below the RSI 30 levels. Then suddenly the uptrend started and the flat V-shaped Sharkfin pattern structure was formed.
3-)Write the trade entry and exit criteria to trade sharkfin pattern (Clear Charts Needed)
Trade Entry Criteria
If we want to make a good profit in cryptocurrency trading, we must act in a planned and programmatic way. We have to set some criteria for trading.
Buy Position
First we need to add the RSI oscillator to the chart we will be using.
We should wait for the RSI of the downtrend market to drop below 30.
Then, after a sudden uptrend starts, we should wait for the RSI to rise to the 30 level and a V shape to form.
We should enter a buy order when the RSI rises to 30 and a V shape is formed.
Sell Position
First we need to add the RSI oscillator to the chart we will be using.
We should wait the RSI of the uptrend market to rise above 70.
Then, after a sudden drop starts, we should wait for the RSI to drop to the 70 level and an inverted V shape to form.
We should enter a sell order when the RSI drop to 70 and an inverted V shape is formed.
Trade Exit Criteria
Determining take profit and stop loss has an important place in risk management. We can call it the key point for exit criteria.
Buy position
After entering the position, we should set a stop loss to avoid too much loss.
After entering the position, we should set up take profit.
The take profit level must be equal(1:1) to or greater than the stop loss.
Sell Position
After entering the position, we should set a stop loss to avoid too much loss.
After entering the position, we should set up take profit.
The take profit level must be equal(1:1) to or greater than the stop loss.
4-)Place at least 2 trades based on sharkfin pattern strategy (Need to actually place trades in demo account along with Clear Charts)
First DEMO
First, we added the RSI indicator to our chart in its standard settings.
When we examine the chart later, we see that the market is in an uptrend. That's why we need to look for a position for a sell position.
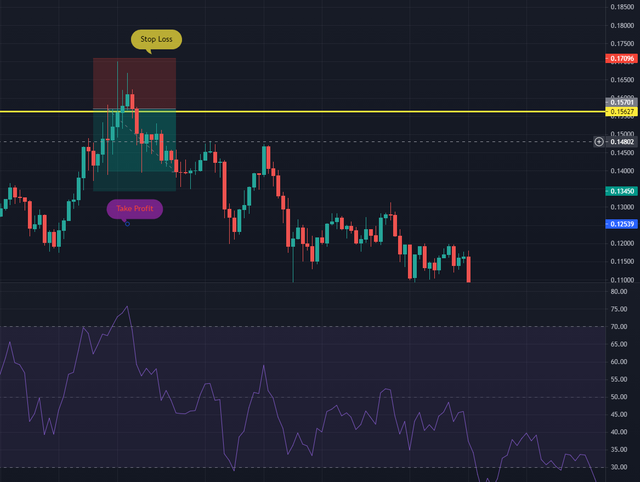
When we look at the price action on the 15-minute ATOM chart, we can see that a clear Sharkfin pattern, Inverted V has formed. When I look at the RSI indicator later, I see that it quickly rises above the 70 level and falls below the 70 level at the same speed. We see that a clear Reverse V has formed on the RSI indicator, as in the price action.
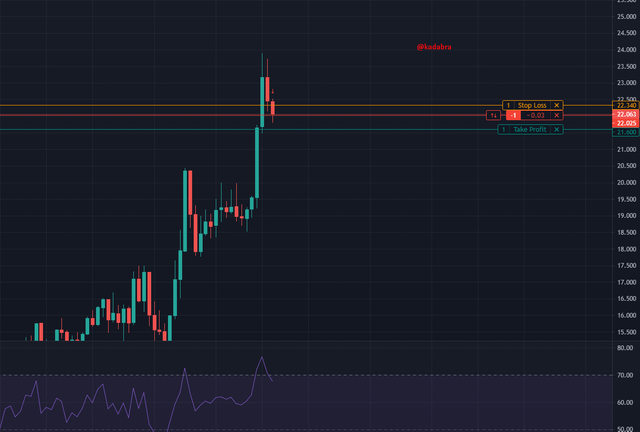
After performing our necessary analysis and RSI verification, I open my sell position at $22,025.
I place my stop-loss at $22,340 as I don't think the price will go up too much later. I place my take profit level at $21,600.
Second DEMO
First, we added the RSI indicator to our chart in its standard settings.
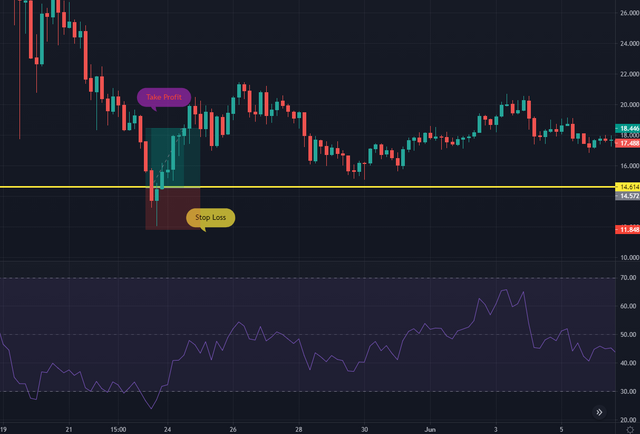
When we examine the chart later, we see that the market is in a downtrend. However, when we look at the RSI indicator, we see that it made a rapid decline below the 25 level and then quickly rose. When we look more carefully at the price chart and the RSI indicators, we can easily see that they both form a Sharkfin model V.
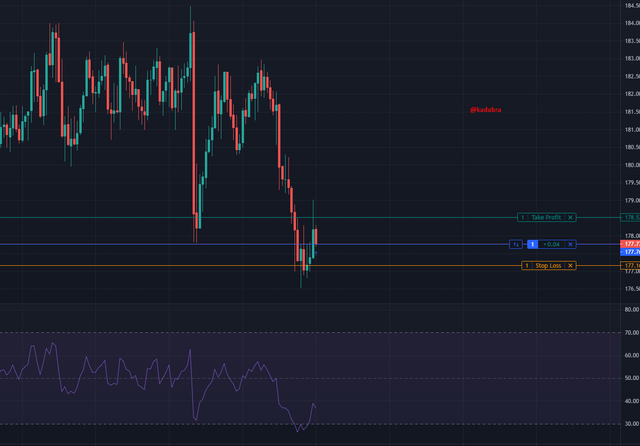
Then I see the RSI value is clearly above the 25 level and I open my buy position at $177.76.
Next, I place my stop-loss at $177.1 and my take-profit level at $178.5.
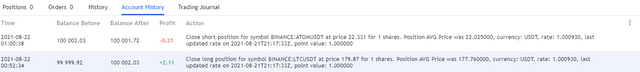
Profit/Loss:
We made +2.11$ profit from the transaction we made in LTC/USDT parity.
In the transaction we made in ATOM/USDT parity, we lost -0.31$.
It's a pattern I've come across for the first time. It was a very informative homework for me.
Thanks @cryptokraze