Steemit Crypto Academy Season 2-Week4 | Cryptocurrency Trading with RSI

Introduction :
Traders are always looking for tools that help them in trading within the financial markets, whether it is stock or cryptocurrency markets, and technical indicators are among the priorities of the tools that traders always use.
When looking at the existing technical indicators, we will find that there are many and many technical indicators that differ in the method of use, and usually a trader searches for a versatile indicator to provide them with entry and exit (Buy/Sell) signals in the market, so the RSI (Relative strength index) is considered one of the indicators that traders prefer to use given the ease of use and understanding which make it a very important ally in trading success.
You want to start investing in cryptocurrency and you want to give this RSI indicator a try, but you want to know a little more? We explain to you as best we can and in detail how this indicator works and how best to use it.
Let's start at the beginning and then go a little deeper.
What is the indicator RSI ?
The indicator is used to help determine when the price of cryptocurrency is too far from its "expected" value and thus allows the trader to profit and sell at a higher price before the market corrects itself. With the help of the Relative Strength Index (RSI), a trader can gain better entry points, making it an essential tool for trading in the volatile cryptocurrency market.
It should be noted that the RSI was developed 40 years ago by technical analyst Willis Wilder. The momentum indicator uses a fairly complex formula to determine whether an asset (stocks, cryptocurrencies, etc.) is overbought or oversold.
Fortunately, you don't need to know what the formula is or how it works to profit from the RSI.
For beginners, here it is:
RSI = 100 - 100 / (1 + RS)
What is RS?
Well, it is:
Average earnings over a high period over a given period / Average loss over a high period during this period
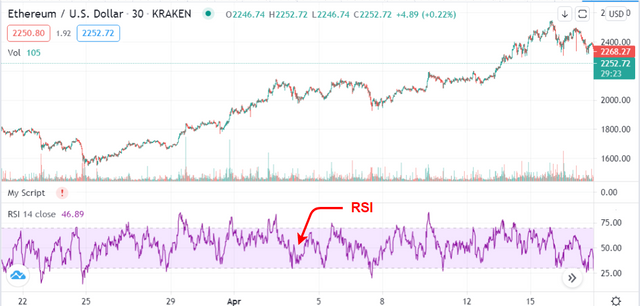
On the chart below we have added the RSI. As you can see, the indicator fluctuates as it tracks the fluctuations in the price of Ethereum.
RSI measurement and parameter :
The RSI is an oscillator, and it consists of several points that form a line that swings from top to bottom after market fluctuations. So what is an oscillator? In technical analysis, an oscillator is an indicator that measures the performance of an asset in an often limited way. This means that the indicator is moving between two extreme values. An oscillator gauge helps to get an idea of how volatile the market is.
By default, the length of the RSI is 14, then its breadth will depend on the time unit of your chart. On the 1-minute chart, the most recent RSI value will take into account the last 14 minutes. On the graph for 1 day, last 14 days, etc.
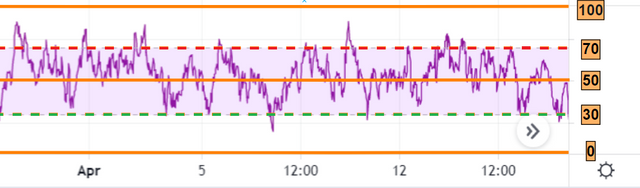
The RSI value is always between 0 and 100. If there are more significant increases, the RSI will be above 50 over the period. If we record more steep dips, it will be below 50 during this period.
Two identical areas are identified with the market situation. The upper range, between 70 and 100, corresponds to the overbought zone and is outlined by a dashed red line in the image. The lower range is between 0 and 30 and corresponds to the oversold region, marked by a dashed line in green.
Adding and configuring RSI :
For this I will use the dynamic graphical and technical analysis platform TradingView:
- Create a free account and access the various services.
- Click on the Chart tab and choose a pair to trade
- To add the RSI indicator:
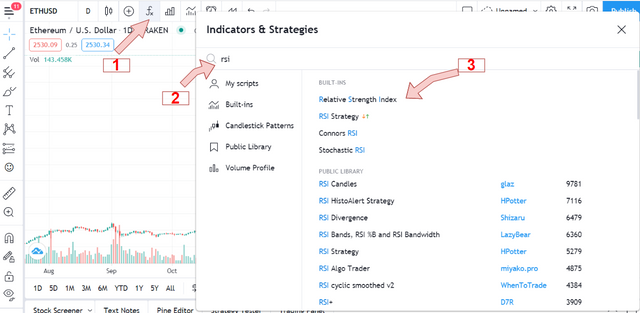
1-- Select the "fx" button
2-- Type RSI in the search box
3-- Then choose “Relative Strength Index”
- To configure it:
It will appear below the price chart. To see the custom window click on the corresponding Settings icon (highlighted with the arrow shown in the screenshot below).
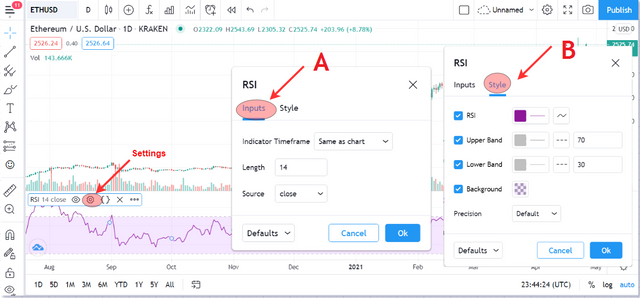
A. Inputs
- Length (period): The number of bars that the indicator analyzes to indicate the average value. The default value for the period is 14. This means that the price change for the last 14 days is taken into account.
- Source: it is the price quality that is taken into account in the equation. By default, it is the closing price. You can also choose the opening price, the highest or the lowest. There are three different types of average rates.
B. Style:
- RSI font (font color): You can choose the thickness and color of lines and levels, and the fill color between levels.
- RSI (upper / lower limit) values: The default limits are 30 and 70. You can change them according to your trading strategy
- Precision: Levels are accurately estimated to the fourth decimal place. If the parameter is set to 0, then the value of levels is 30, 70, etc.
Overbought and Oversold :
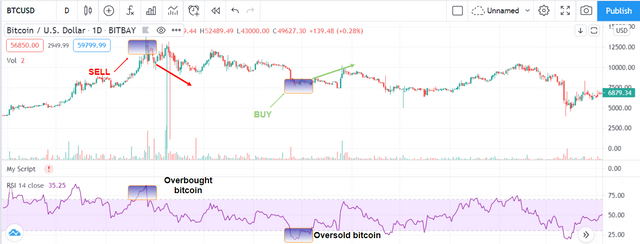
The terms overbought and oversold are very frequently used in technical analysis. The RSI is therefore the preferred indicator for measuring these different concepts. This is the most common use of the indicator.
- Overbought :
An asset is considered overbought when demand exceeds supply so much that the market price rises high enough. The RSI makes it possible to determine such a condition. This is because the 70 level of the RSI represents the limit of regular upward price movements in a bull market. When the RSI, therefore, goes above 70 and moves in the 70-100 zone, we say that the asset is overbought.
The RSI mostly moves between the 30 and 70 levels. So when its value goes above 70, the oscillator tells us that a price reversal is imminent.
- Oversold :
An asset is considered oversold when supply exceeds demand such that its price drops significantly. The RSI is an excellent indicator for determining an oversold condition. In general, when the value of the RSI drops below 30 and moves between 30 and 0, the asset is said to be oversold.
Knowing that the RSI oscillates most of the time between 30 and 70, the passage below 30 signals to us at the same time a possible reversal.
We, therefore, use the RSI mainly for spotting signals of market reversals. When its value is below 30, analysts will look for signals of an upward market reversal. Conversely, when the RSI crosses above 70, they will look for signs of a downward reversal. There is also another level that determines the market trend.
RSI divergences :
Most traders look for overbought and oversold signals with the RSI. However, there is another way to use RSI, and this one gives even more relevant trading signals. These are the differences.
Typically, RSI follows price, so when price peaks, RSI does the same. When price marks a first high and then a second even higher high, the RSI should normally do the same. We talk about divergence when the price marks a higher high or a lower low, but the RSI does not follow the pattern. We will illustrate this.
- Bullish divergence :
A bullish divergence occurs when the price dips lower, but the RSI marks a higher low.
On the BTC/USD chart above, the cryptocurrency's price action is showing a bearish divergence. This is because the second trough in the RSI is not synchronous with the second trough formed by Bitcoin. Bullish divergence is a relevant trading strategy for Bitcoin when the general trend is bullish.
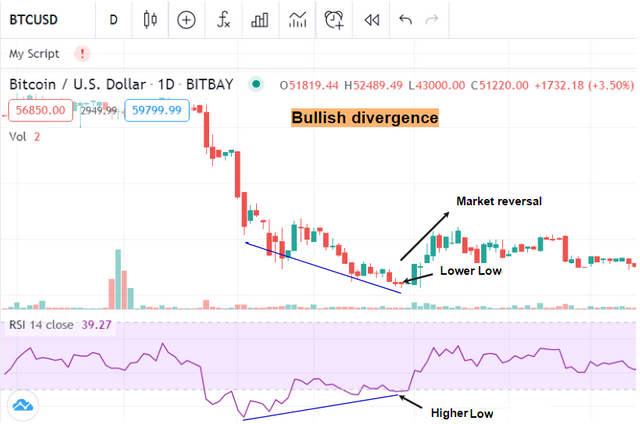
A bullish divergence is a strong signal for a market reversal. When it occurs in the oversold zone, then it becomes more relevant.
- Bearish divergence :
We talk about bearish divergence when the price peaks higher, but the RSI peaks lower.
The bitcoin chart below has formed a bearish divergence with the RSI. The result was a drop in the price of the cryptocurrency.
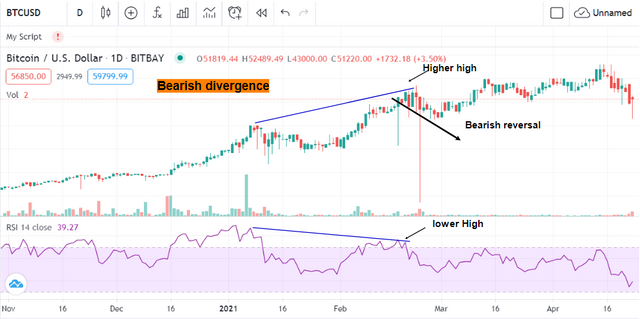
Like the bullish divergence, the bearish divergence is a strong reversal signal. And it is even more relevant when it forms in the overbought zone of the indicator.
Market Trend :
The RSI can also be used to determine the market trend. To do this, we will use level 50.
Generally speaking, when the RSI regularly moves above 50, the market is considered to be in an uptrend. Conversely, when the value of the RSI fluctuates regularly below 50, the trend is considered to be bearish.
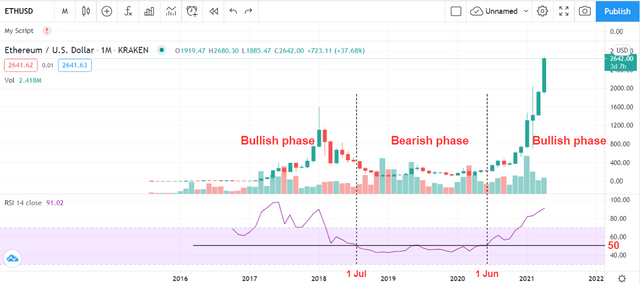
On the Ethereum chart above, the RSI clearly shows us the different stages of its price fluctuation against the USD since the 2017 bubble. In 2017 and mid-2018, the RSI is above its median value which is 50.
The oscillator then drops below 50 during the second part of 2018 and until June 1 of 2020. It tells us that the cryptocurrency as well as the market as a whole is in a downtrend.
From the second half of 2020, the RSI returns above 50, which means that the market has then entered a bullish phase.
Example of a cryptocurrency trading using the RSI indicator:
After we have introduced most of the basic RSI rules, let's provide an example of how a cryptocurrency trading strategy works with this indicator.
Below we will review the TRX/BTC chart, as the following image shows the buy and sell positions based on the signals from the RSI.
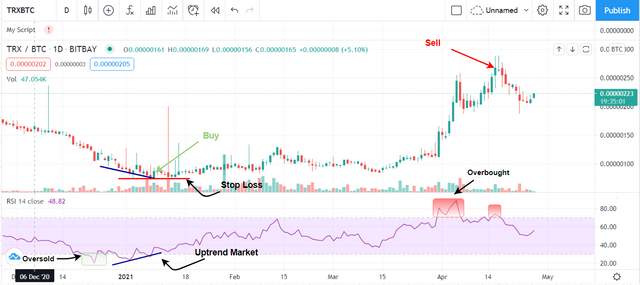
Since the beginning of the chart, we notice a decrease in the price, which is matched by a decrease in the trend in the RSI line. The line immediately enters the 0-30 area, which gives an oversold signal. Shortly thereafter, the RSI line begins to rise, while the price movement continues its downward movement. This creates a bullish divergence between the RSI and price movement.
When the RSI indicator breaks the oversold zone to the upside, most people think that a long position (buy) should be opened, but wait until the bullish divergence is confirmed, meaning after two or three consecutive bullish candles to confirm the entry signal. When this happens, this may create a signal Chart buy, which means you can buy the TRX / BTC pair.
The moment of reversal should be determined directly by placing the stop loss order below the bottom. This is shown by the red horizontal line on the chart.
Why?
To protect ourselves from losses it is necessary to use a stop loss order since the RSI indicator can give many false or early signals if used as a stand-alone instrument or when combined with other confirmation tools. The best place to stop your loss is your last high or low to the most recent high.
The price continues to rise and so does the RSI line in parallel. This is what you can complete the buy position until the RSI reaches the 50 line, where you can close part of your position.
When the RSI reaches the overbought zone at 70, you must exit the trade by selling, as indicated by the red boxes on the chart the moment the RSI enters the second overbought zone, causing the position to close completely.
Conclusion :
Personally, I consider RSI and other oscillator type indicators interesting in addition to price analysis (support and resistance, trends, candlesticks). The RSI can stay in the overbought zone for a long time and in oversold for a long time before we can see a reversal. This can lead to a lot of false signals. I think it is best to use this as an additional confidence factor in your baseline assumption.
Homework-task 4:
- What is the Relative Strength Index - RSI and How is it Calculated?
- Can we trust the RSI on cryptocurrency trading and why?
- How do you configure the RSI indicator on the chart and what does the length parameter mean? Why is it equal to 14 by default? Can we change it? (Screen capture required)
- How do you interpret the overbought and oversold signals when trading cryptocurrencies? (Screen capture required)
- How do we filter RSI signals to distinguish and recognize true signals from false signals. (Screen capture required)
- Review the chart of any pair (eg TRX / USD) and present the various signals from the RSI. (Screen capture required)
- Conclusion :
Rules :
Try to read the lesson and the assignments carefully before you start editing.
You must write an essay that contains at least 300 words.
Make sure that you post your homework into the SteemitCryptoAcademy community.
Use copyright-free images with mention of its source, if possible, produce your own.
Plagiarism is forbidden in Steemit Crypto Academy, and its perpetrators may face serious penalties.
This homework assignment will run until 8th May'2021, Time- 11:59 PM UTC.
Include in your post among the first five hashtags #kouba-s2week4 and #cryptoacademy.
For users who are powering down, they will not be voted and considered excluded from participation.
Additionally, users with a reputation below 50 won't benefit from voting for their homework.

Cc:-
@steemitblog
@steemcurator01
@steemcurator02
Aquí mi tarea profesor kouba01 tarea RSI y mi captura de pantalla en Twitter

.
https://steemit.com/hive-108451/@blessingkasabe/steemit-crypto-academy-season-2-week-4-homework-post-for-kouba01-cryptocurrency-trading-with-rsi
Having read about RSI earlier too but not with such a great detail. I think you have explained every perspective of RSI. I shall soon start working on homework post.
Basically we need to understand the RSI in general so as to be able to spot the right signal.
Are we supposed to write mathameitcal calculation or theoretical ?
Thank you sir.
You are free to explain what the formula is. I want to see your creativity and additions
Ok boss.
This lesson is really informative. Thanks for the time you took to explain the RSI concept
Muy buena explicación profesor, nos pondremos a trabajar en la tarea.
Professor you have not reviewed my work yet:
https://steemit.com/hive-108451/@bibsonhabib/steemit-crypto-academy-season-2-week2-or-homework-task-cfds-for-kouba01
Thank you for another outstanding lecture. Please keep the tempo prof. We are grateful for the lectures. I'm eager to participate in this.
My entry
https://steemit.com/hive-108451/@simonnwigwe/crypto-academy-week-12-homework-post-for-kouba01
Fortunately, you don't need to know what the formula is or how it works to profit from the RSI. Wow
Buenos días Prof por aquí mi tarea..
https://steemit.com/hive-108451/@adriancabrera/steemit-crypto-academy-temporada-2-semana4-or-comercio-de-criptomonedas-con-rsi-koubai01-by-adriancabrera