Crypto Trading Strategy with Median Indicator ~Steemit Crypto Academy-Homework post for professor @abdu.navi03
Hello friends,
Welcome to my blog. It’s amazing how time flies and we are already in season 6 of week 4 of the crypto academy.
Last week lectures laid more emphasis on support and resistance levels, which is also part of technical analysis. This week we will be talking about the use of indicators.
Read along with me as I explain how much I have understood from the lecture for this week.
designed using canva
Explain your understanding with the median indicator?
A good trader will always use good technical analysis tools so as to make a good profitable trade. The benefits of using technical analysis tools cannot be underestimated. Indicators are classified under it, as a tool. There are various indicators available on different trading platforms, but we will be focused on the Median indicator.
Median indicator is an indicator that shows the exact trend with which the market is moving, hence it could be referred to as a trend-based indicator. It is an indicator with a unique characteristics, in that it makes use of the ATR to form a channel with the Median line which denotes the middle, and can be used to measure the volatility of the market. These lines are usually seen above and below it. This particular characteristic makes it outstanding among all other trend-based indicators.
Am indicator that could be compared or likened to the Median indicator is the EMA, and the difference in value between both of them forms either a purple or green color cloud which could be used to know if the market is bearish or bullish. In other for the color cloud to occur, the median line must cross either above or below the EMA, if the values of their length are same.
The median indicator is one that can easily be used by just knowing the principles guiding it. It makes use of colors which are very important and should be watched out for when using the median indicator.
When there is a cross of the median line below the EMA, A purple color cloud is occurs, which is used to show that the market is bearish and a downtrend is bound to occur, and this should be the best time to make a sell entry, while the cross of the median line above the EMA, produces a green color cloud which denotes that the market is bullish and an uptrend is bound to occur., this is the best time for a buy entry.
Parameters and calculations of median indicator?
To have access to the median indicator, I visited tradingviewsite, I clicked on chart, after selecting the asset pair, I clicked on (fx) which is the symbol for indicators, and then I searched for the median indicator and clicked on it. Once I clicked on it, it automatically appears on the chart.
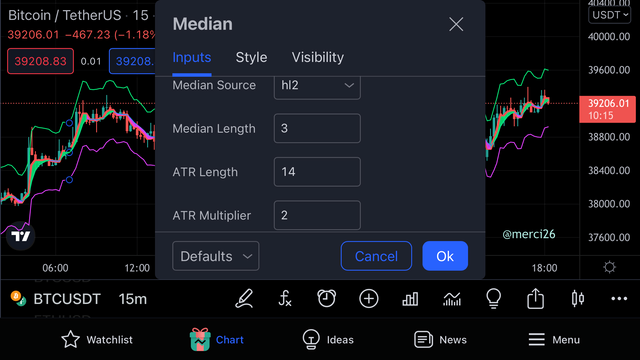
Once the indicator appears on the chart, click on settings icon. After clicking on settings, under the input option, the parameters associated with the median indicator is seen.
tradingview
They include;
• Median source
• Median length
• ATR length
• ATR Multiplier
Just like I rightly stated above in question 1, the median indicator is used to show the difference between the value of the median line when compared with the Value of the EMA, with both having same length.
The calculation is as follows;
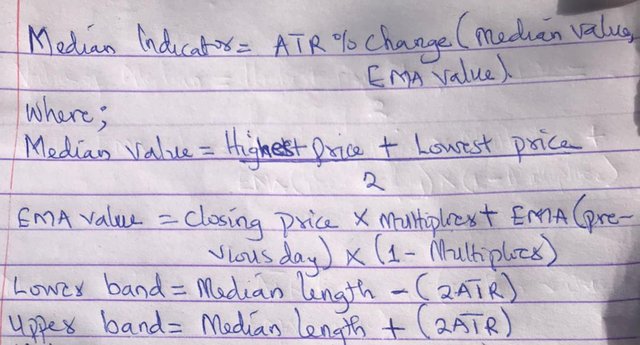
Note:
If the percentage change of EMA is greater than or equals that of the median value, a purple color cloud occurs, and if the percentage change of Median is greater than or equals that of EMA, a green color cloud occurs.
Uptrend from median indicator (screenshots required)
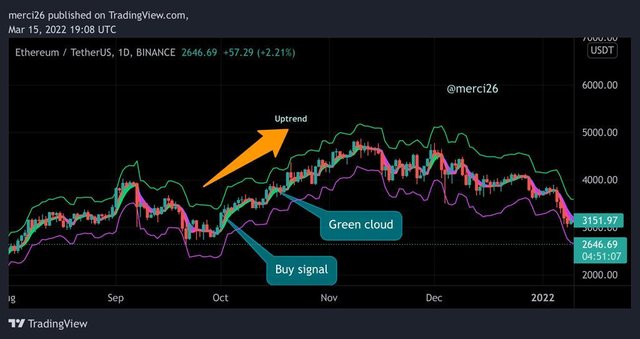
Median indicator is one that shows if the market is in and uptrend or downtrend. Identifying an uptrend using the median indicator is quite simple, if the principle is understood. An uptrend is seen when the median line is above the EMA. A green cloud is usually seen when this occurs.
tradingview
From the ETH/USDT chart above, you could see the green cloud. It also shows that the trend was in bearish (purple) cloud and then it changed to green(bullish). It is a very good time to place a buy entry.
Downtrend from median indicator (screenshots required)
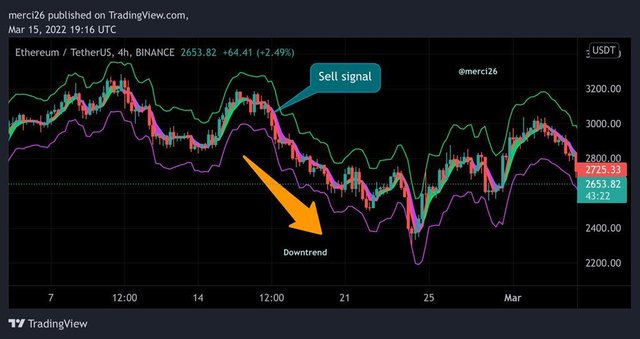
A downtrend is identified when the median line is seen below the EMA. Once this occurs, a purple cloud is seen.
tradingview
From the chart above,it is seen that the trend of the market was bullish(green cloud) and then a purple cloud is formed showing that it has moved to bearish. This is a good time a trader can take a sell position in the market.
Identifying fake signals with median indicator (screenshots required)
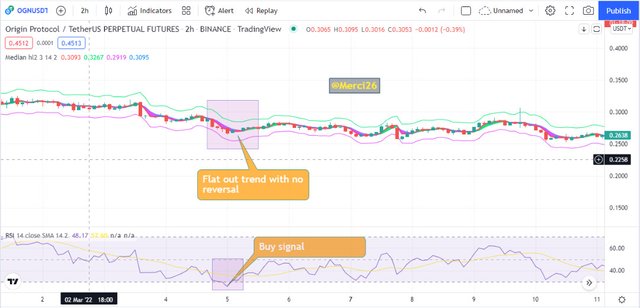
In the crypto world, we have whales who try to manipulate the market in their favour to provide liquidity for themselves thereby trapping small traders with the use of false signals. Median indicator is a good one, but using only one technical tool in a trade is not 100% accurate, hence the use of other indicators or tools depending on the one that fits the market at that time, or ones trading strategy.
tradingview
I used the RSI indicator to filter out false signal. It is an indicator that measures the volatility of the market, by identifying regions of overbought and oversold. It works using values of 70 and 30. Values ranging from 30 and below, denotes that the market is in an oversold region while values ranging from 70 and above shows that it is in an over bought region.
Open two demo trades, long and short with the help of the median indicator or combination that includes a median indicator (screenshots required)
tradingview
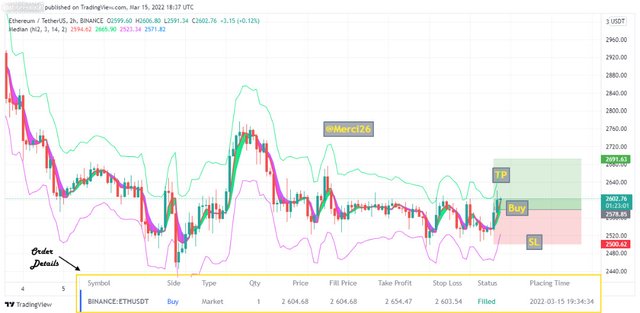
Shown above is the order details of ETH/USDT using the median indicator. Buy order was placed after observing the median indicator turn green, thus, an uptrend is beginning and with no purplish cloud in sight, it is a good time to place the trade as the uptrend may be sustained a little close to the take profit zone which has been carefully placed within a reasonable resistance zone.
tradingview
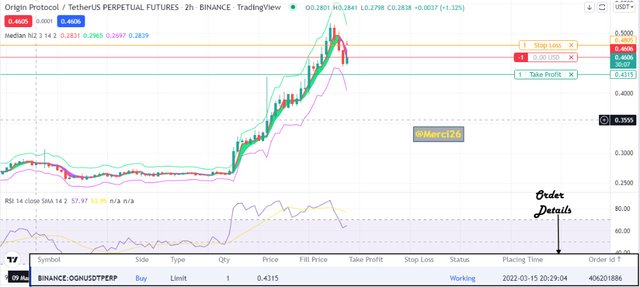
After analysing the asset Origin Protocol/USDT futures, with the aid of the median indicator, and confirmations done with the RSI, I placed a long sell limit order as shown on the chart above. From the median cloud, the market has just enjoyed a long period of uptrend and is now retreating.
Conclusion
The median is a trend based indicator that is quite simple and easy to use if one understands the principle behind it. It can be modified and used depending on the trading strategy of the trader. It is actually not advisable to depend only on the median indicator as it could produce false signals that will lead to huge losses. It is advisable to use other technical tools as well as apply good risk management skills before entering or exiting a trade. Special thanks to @abdu.navi03 for the wonderful lecture.
You've got a free upvote from witness fuli.
Peace & Love!