Fibonacci Tools~crypto academy |s6w4-Homework post for prof @pelon53
Hello friends
Welcome to my blog.
The season is fast coming to an end as we have approached week 4 already. This week the prof @pelon53 discussed about an important technical analysis tool which could be used to detect or show when there will be a reversal in price. That tool is known as the Fibonacci. Read along with me as I explain how much I have understood the lecture.
Explain in your own words what you mean by Fibonacci Retracement. Show an example with screenshots.
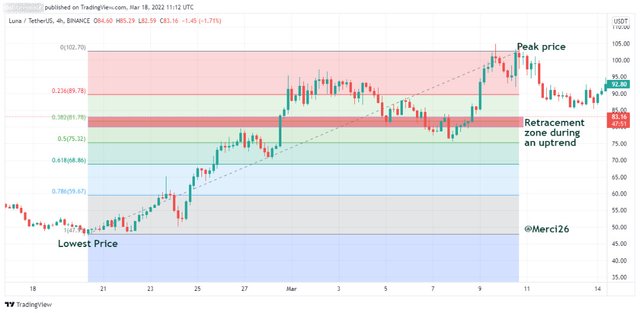
A good trader always try to look at the various phases and aspect of the market before entering or exiting a trade. A trader can look at the various aspects of the market by making use of various technical analysis tools. Fibonacci Retracement is one of that tools, which traders use to determine or point out regions of support and resistance,and also serve as points where traders could be able to place a buy or sell entry. While observing a price charts, we can notice that the price(candlestick) always moves in a zigzag manner, and this is as a result of traders who are trying to either buy or sell an asset. The price of assets, always reverses or continues in the trend with which it is in after a break. When a Fibonacci is added on a price too, it is seen as horizontal lines, and these lines serves as resistance and support to show price reversals. They are usually drawn on recent lows which could be seen as 0% and recent highs which could have a value of 100% while all other horizontal lines serves as support and resistance and this are areas where there could be a reversal in price when Retracement occurs.
Fibonacci Retracement came from the term Fibonacci numbers,which follows a defined sequence and are formed by observing natural occurrence of things. The Fibonacci numbers are set of numbers in which a single number is derived by adding or summing the two numbers before it, with the number 0, serving as a starting number. The sequence with which Fibonacci numbers follows are
0,
1,
1,
2,
3,
5,
8,
13,
21…….. up till infinity.
The Fibonacci Retracement is one that is built on the golden ratio, which has a value of 1.618, and the number following it, should be greater.
Example
Explain in your own words what you mean by Fibonacci Extension. Show an example with screenshots.
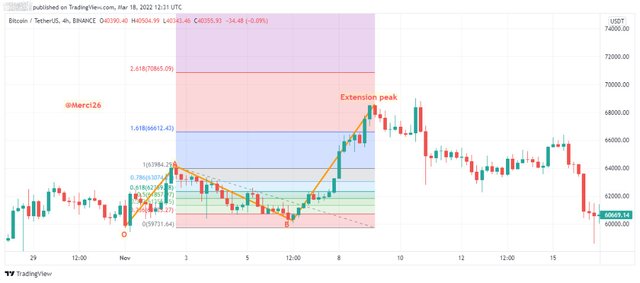
Fibonacci Extension works hand in hand with Fibonacci Retracement, in that it helps to point out important parts on the price chart, where 3 points need to be identified, with the first serving as a start of a movement, the second point indicating end of movement and the third point indicating end of Retracement acting against the move. Retracement Extension It could serve for 3 purposes, and they are;
• identify price points possible for a reversal
• Know if there will be an increase in price after a pullback has occurred
• serve as points where huge profits can be taken.
Fibonacci Extension are actually tools, drawn on charts, it is calculated based on Fibonacci ratio, as they do not really have any formula used in calculating them. Traders often make use of the extension tools to indicate or set their profit making zones.
Example
Perform the calculation of the Fibonacci retracement, for the levels of: 0.618 and 0.236. Pick a crypto pair of your choice. Show a screenshot and explain the calculation you made.
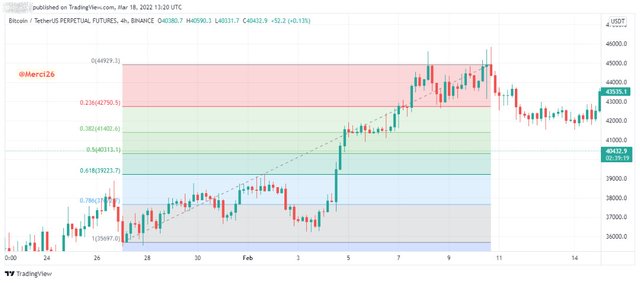
Of the 5 Fibonacci levels, I will be calculating Fib retracement for 0.236 and 0.618 levels for a BTC/USDT uptrend.
The formula used here is:
Fib retracement = A + [(1 - Rn) * (B – A)]
Where: A= Price level at the beginning of the retracement; B= Price level at the end of the retracement; Rn= Retracement level
Hence, Fibonacci retracement, for the level of 0.618 is 39,223.7 USDT.
A= 35697
B= 44929.3
Fib retracement = 35697 + [(1 - 0.236) * ( 44929.3 - 35697)] = 42750.5
Hence, the Fibonacci retracement for the level of 0.236 is 42750.5USDT**
On a Live account, trade using the Fibonacci retracement, screenshots are required
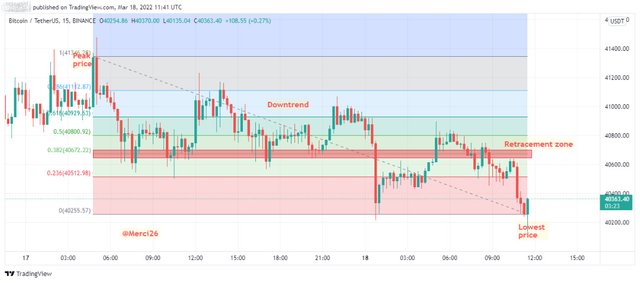
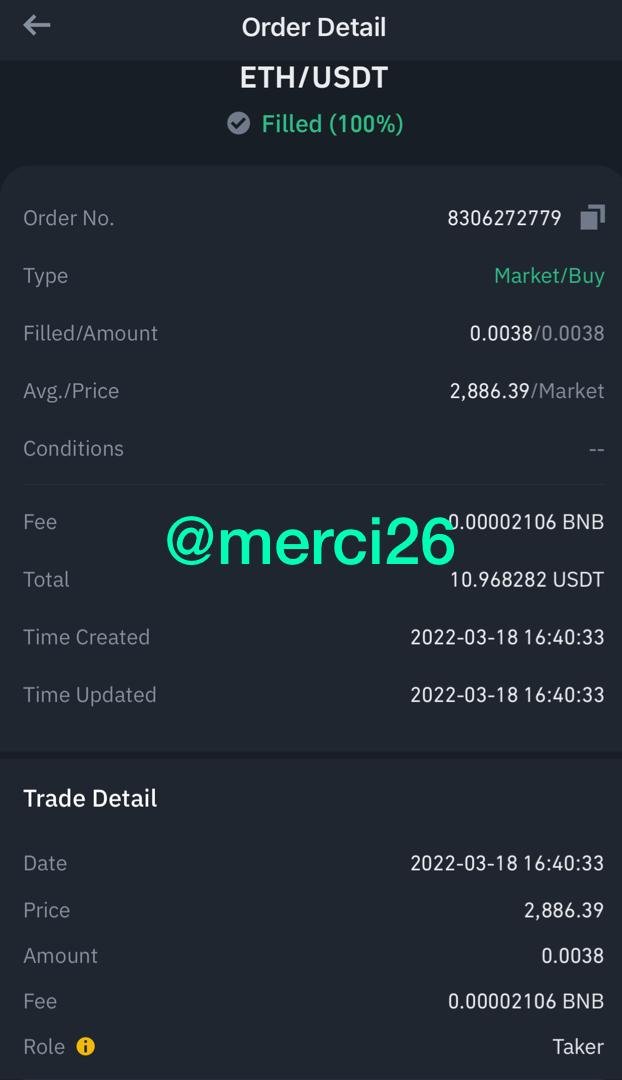
First, I visited my trading view application, carried out my technical analysis using the Fibonacci Retracement and then went ahead to buy my coin.
On a Demo account, make a trade operation using the Fibonacci extension. Screenshots are required.
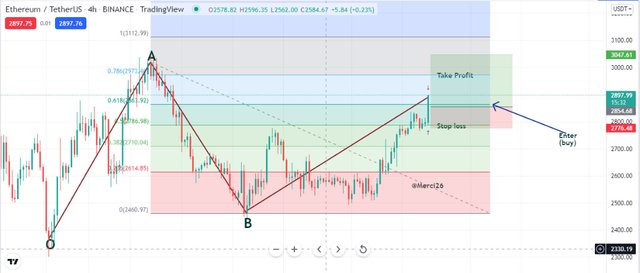
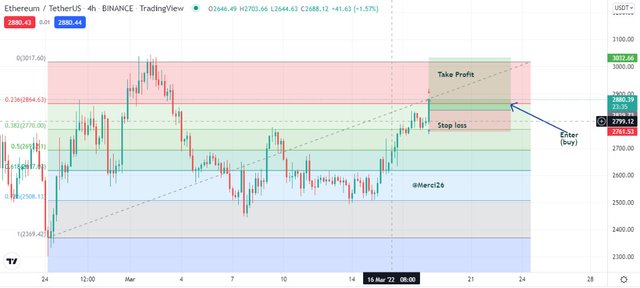
On the ETH/USDT 4h timeframe chart, I executed a long trade using Fibonacci extension signals. The price was initially in an uptrend until a trend reversal from occurred. The price retraced from A to B. Here, the Fibonacci extension was drawn. Following this movements, I placed my stop loss just below the 0.618 extension and my take profit just above it.

Conclusion
It is always advisable to understand the principles guiding all technical tools before using them. Fibonacci Retracement and extension are good tools that can help us know when a reversal will occur, as well as when to place a trade so as to get maximum profit from the trade.thanks to @pelon53 for the wonderful lecture.
