Support and Resistance Breakout ~Crypto Academy S6week3||Homework post for @pelon53
Hello friends,
Welcome to my blog. We are already in season6 week 3 of the academy. This week, our own professor @pelon53 have done a great job in explaining resistance and support breakout levels. Read along with me as I perform my task.

designed using canva
Explain in detail the advantages of locating support and resistance on a chart before trading?
A good trader will always look out for the market before entering or exiting a trade, and one of the ways to do this is with the use of technical analysis. Support and resistance levels are technical analysis tools which most traders look out for because of it’s numerous advantages such as;
• Identification of Exit and Entry Points.
The support and resistance point are usually determined by the rate at which assets are supplied and demand. These regions are good places to either exit or enter a market as we are sure that once the price gets to any of these points, there will either be reverse or a breakout in price action. Setting good stop loss points as well as take profit will help us make a good trade.
• Good trading signals
Support and resistance are good tools to help us know when there is a breakout in price. Sometimes these breakout might be false breakout, as it is mostly done by crypto whales to provide liquidity, using support and resistance in addition to indicators such as the parabolic sar, and moving averages will help us filter false breakout.
• Movement of the market
support and resistance helps us know the direction with which the market is moving as well as the trend with which the market is in wether it is in a downtrend or uptrend. The trend can be determined by studying and understanding the various types of resistance and support levels.
• confirmation of confluence
It is often noticed that resistance and support zones are determined by buyers and sellers and as such prices often react when they approach these zones. To make a perfect trade or increase one’s changes of good trade, it will be wise to use multiple tools, such as the combination of resistance and support, as well as other indicators will help us achieve this.
• Flexibility
Resistance and support are simple and quite understandable, when it comes to its use. It can be used in low and higher time frame depending on the kind of support or resistance you are looking for, as well as suitable for both ranging or trending market, and also suitable for any trading style.
Explain in your own words, the breaking of supports and resistance, show screenshots for the breaking of a resistance, use another indicator as a filter.
Support is usually at the bottom floor which is characterized by high buying of asset, while resistance is usually at the top floor and it is characterized by high action of selling by traders. The phenomenon behind both is that, at resistance level, the price is expected to move in a downtrend as a result of high selling or price is expected to move upwards at the support level, but this does not always happen. This is where breakout comes to play. When price gets to support or resistance and breakout occurs, the following things are bound to happen
• price will continue to move in the same trend as previous one or
• there will be a reverse in the trend, either from bullish to bearish for resistance and bearish to bullish for support.
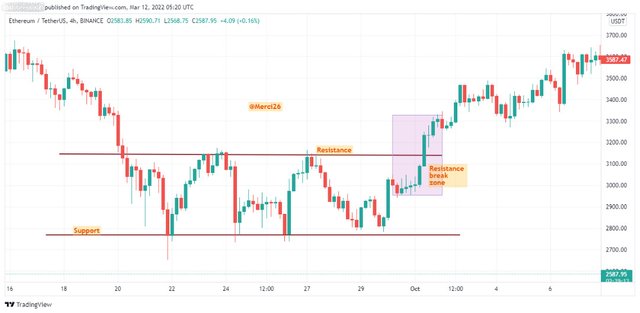
Resistance is usually the top region classified by high rate of selling. Traders are able to utilize a push of price in this zone to sell off their asset. Once a price is at resistance, a break is bound to happen which could continue the bullish trend or push it downwards. It is often advisable to open a buy entry in this region as it is often noted that a bearish trend will occur once buying action closes at resistance level, but if it breaks above resistance level, then the bullish trend is bound to continue.
source
Show and explain the break of a support, use an additional indicator as a filter, show screenshots.
Support is an area or zone that shows high buying of asset. It is always expected that when the price hits the support level, a bullish movement is expected, but this is not so, as most times, when price reaches the support level, a breakout occurs, and the bearish trend tends to continue.
source
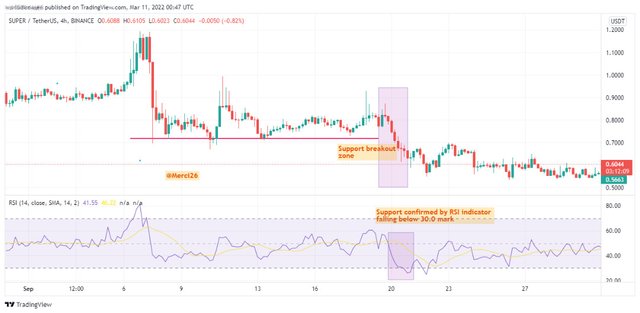
From the screenshot above, I used the super/usdt pair with RSI as an indicator. The RSI is an indicator that is used to show regions of overbought and oversold. Values of 30 and below is used for oversold while values of 70 and above shows region of overbought. As seen in the screen show, support level is identified by the RSI indicator, showing that it is in the region of oversold.
Explain what a false breakout is and how to avoid trading at that time. Show screenshots.
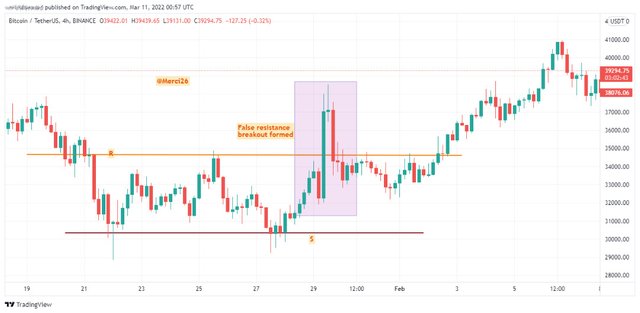
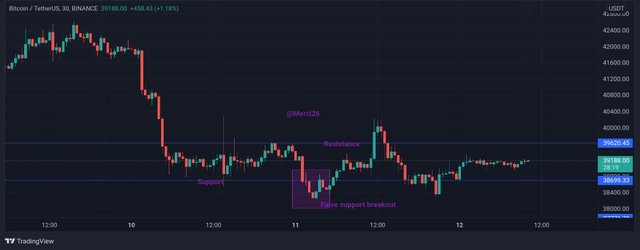
False breakout are often caused by the whales as a form of getting liquidity for themselves. They use this breakout as a trap and most traders who do not really understand the concept of breakout as well as how to identify false breakout end up losing great funds. In false breakouts, the price movement is not able to exceed or move below the resistance and support level. The price tends to break, and then go back to the same price momentum making traders make wrong moves. Resistance and support zones are where most traders are able to make huge profit, as such these whales tend to trap traders using false breakout.
source
source
It is true that it is often difficult to identify the exact trend with which the market will move once there is a breakout either at the resistance or support level, it is usually often advanced that a trader do not just rush into a trade once a breakout is noticed, it is wise to wait for a break and then allow the price to retest so as not to be trapped by the whales.
It is also wise to use other technical tools in addition with the support and resistance strategy. The use of indicators such as moving averages, RSI, Parabolic sar as well as volume indicator will help us avoid trading using false breakout.
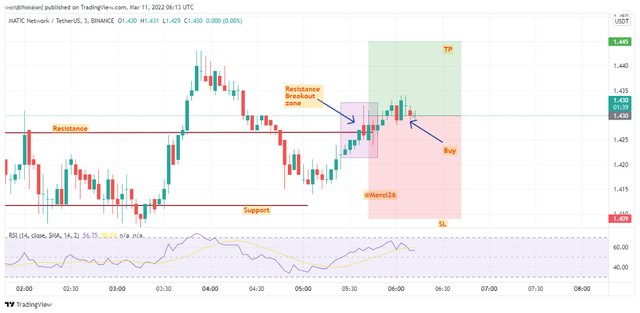
On a demo account, execute a trade when there is a resistance breakout, do your analysis. Screenshots are required.
I placed a buy order for MTC/USDT after identifying the resistance breakout zone and verifying that the next candle is formed without a pullback. I used the RSI indicator to confirm the direction of the trend and placed an order.
source

source
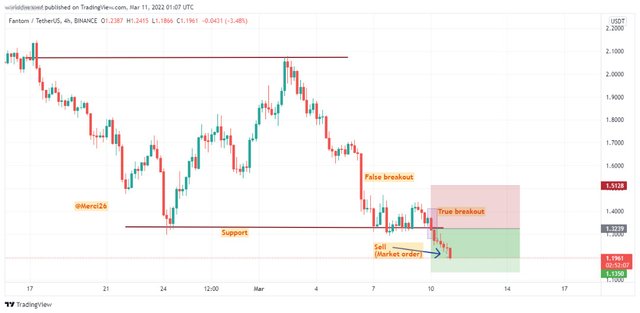
In a demo account, execute a trade when there is a support break, do your analysis(screenshots required)
I placed a sell order for FTM/USDT after identifying the support breakout zone and verifying that the next candle is formed without a pullback.
source

source
Conclusion
The use of support and resistance strategy during trading is a very profitable one, as it shows us the trend with which the market is moving as well as when to enter or exit the market. Traders also need to be careful as most times, whales make use of false breakout to trap most traders and making them loss huge capitals as they provide liquidity for themselves. It is wise to always look out for breakouts as well as using indicators such as RSI, bollinger bands, etc to filter as well as identify false breakout. Special thanks to @pelon53 for the wonderful lectures.
