[ Effective Trading Strategy using Line Charts ]-Steemit Crypto Academy | S6W1 | Homework Post for @dilchamo
The steemit crypto academy remains a valid option to help us learn so much about trading, professor @dilchamo left no stone upturned as she extensively described all we need to know about line chart as a trading strategy.

Define Line charts in your own words and Identify the uses of Line charts.
The history of the line chart could be traced back to Charles Dow who was only interested in the close of a market asset, he, therefore, connected the highs and lows of an asset through a graph. Although Charles Dow's death made it impossible for him to complete his theory on the market he had other people pick up the work from the point where he stopped and continued working on it from that point.
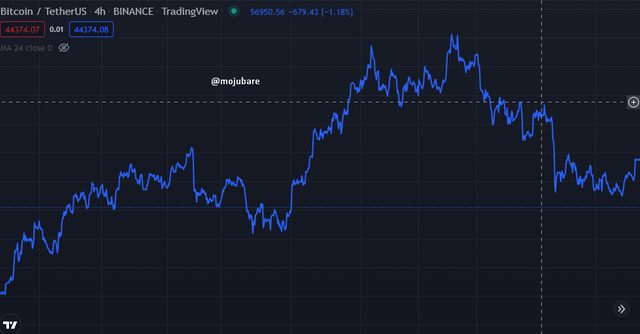
A line chart is a chart pattern that shows the price of an asset within a specific period. A line chart is different from other crypto charts because it is extremely simple and it uses a 2D data representation method. A line chart is a simple visual display of data, major data are connected in a straight line through points.
A line chart is known to be one of the most simple ways to understand financial trading and financial data which could either be in a curved or a straight pattern depending greatly on the type of analysis being carried out. A line chart is a great and simple method for investors to identify a high and a low market and this is as a result of its clear data visualization, it is the extreme simplicity of this chart that makes it a preferable form of data analysis amongst other available trade charts for traders.
The uses of a line chart.
For easy identification of trends and dips.
There is great ease with the identification of trends (either an uptrend or a downtrend), with a simple glance at a line chart, a trader can easily identify if it is a good choice to jump into the trade or jump right out of the trade.A clear and proper representation of the market.
A line chart helps with a clear and easy identification of what the market looks like and knowing this will help traders make effective plans on what the future market will provide the trader with the option to either make future investments or not.Easy identification of support and resistance.
A line chart clearly shows a trader the possible point of resistance and support which further helps the trader identify the possible future occurrences of the trade.Elimination of noise in a chart.
I have previously established the great simplicity associated with the use of a line chart, line chart gets rid of different noises and complexity that other chart patterns present and makes it extremely simple for traders to predict trade direction.
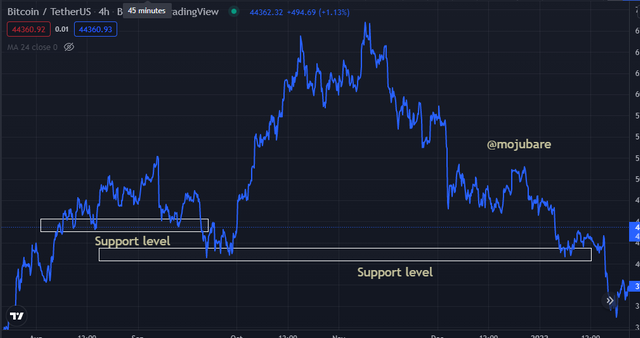
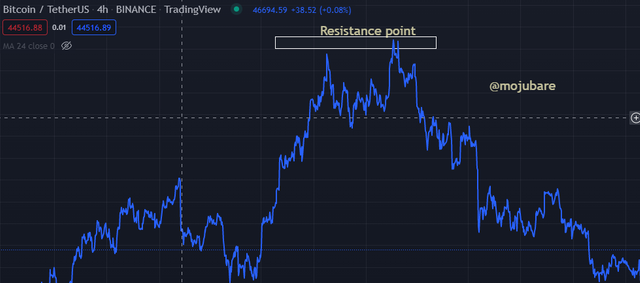
How to identify support and resistance levels using line charts (Demonstrate with screenshots).
A huge market trend usually occurs prior to a little retracement in the market. The presence of supports and resistance in a chart makes it easy for the future price of an asset to be identified by a trader, most traders usually rely on supports and resistance in a chart in order to get a market forecast.
We know that the market is a field triggered by supply and demand, we begin to have a more bullish market when there are more people buying into the project and on the other hand, we begin to have a bearish market when we have people who are pulling out their investment from the project.
A point of resistance provides an opportunity for sellers to sell their tokens since it is an indication that sellers are getting tired of the entire situation and leaving your investment in the market may result in a huge loss.
A point of support on the other hand is usually an indication to have buyers take advantage of the market and make investments. Investors at this point know that this is a good point to buy.
Tips to identify a point of support with a line chart.
You need to first understand that you will have more effective support when you have your line of support touching at least 2 lines successfully.
Identify a point of reduction in momentum, this point is a sign to show that there is an experience of weaker sales.
After the identification of the point of reduction in momentum, figure out the previous point of retracement and place your first horizontal line.
With the use of a trendline, draw a horizontal line that will directly touch another point of retracement.
Tips to identify a point of resistance with a line chart.
Resistance is the exact opposite of the point of support which shows that there is a weak buy order and it is time to pull out of the market.
Remember that the line of resistance is effective when it touches at least 2 lines successfully.
Search for an initial point of retracement and place your first horizontal line.
With the use of a trend line, draw the line to touch a second point.
Look out for the point that indicates momentum reduction.
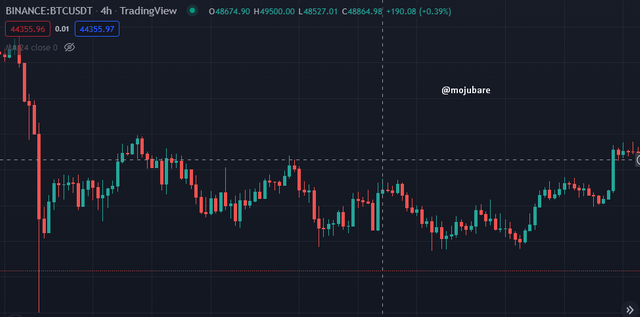
Differentiate between Line charts and Candlestick charts. (Demonstrate with screenshots).
Line charts and Candlestick charts presents traders with a clear representation of market operations, the both charts helps traders make buying and sales decisions accurately. It is usually advisable for traders to utilize the combination of both line and candlestick charts in order to attain a more efficient trade result.
| Line Chart | Candlestick Chart |
|---|---|
| Line charts are extremely simple and straightforward | Candlesticks are more complex than line charts. |
| A novice trader can understand line charts | It takes an experienced trader to understand candlestick charts. |
| Line charts only displays dialogue between buyers and sellers | Candlestick uses graphical content (e.g) high, low, opening and closing points. |
| Line charts provide less information about the price | Candlestick chart provides information about momentum. |
| Line charts helps traders connect to a quick market conclusion | Candlestick charts makes clear different available market structures. |
Explain the other suitable indicators that can be used with line charts. (Demonstrate with screenshots).
There is no perfect indicator, every indicator has its own positive side as well as flaws. The combination of a good indicator with a line chart will make it clear and easy enough for traders to identify possible points of support and resistance.
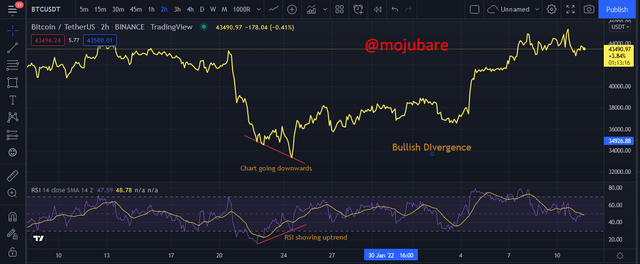
Relative Strength Index (RSI): RSI is an indicator that measures the strength og price change, it helps traders figure out overbought and oversold situations of an asset price. An RSI has a reading of 0 to 100, when values get to 70 and above, it indicates an overbought market and when an RSI reading goes to point 30 and below, there is an indication of an oversold market.
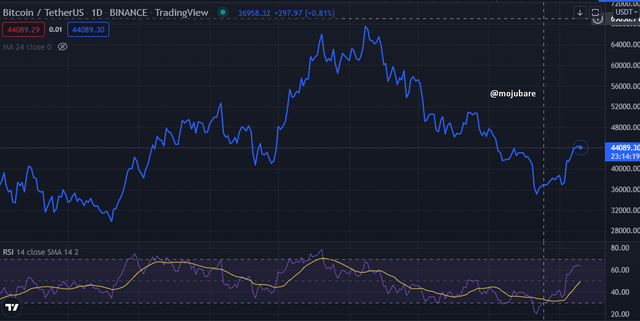
RSI can be a very good indicator to identify divergence in a chart. Divergences are used to identify pullbacks and reversals. Divergences occur when the price of an asset is opposite direction with the indicator. The disagreement between the price and RSI causes a divergence.
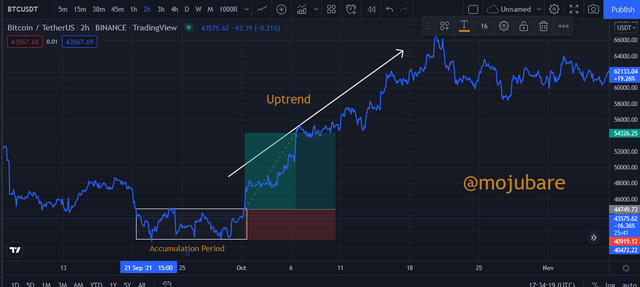
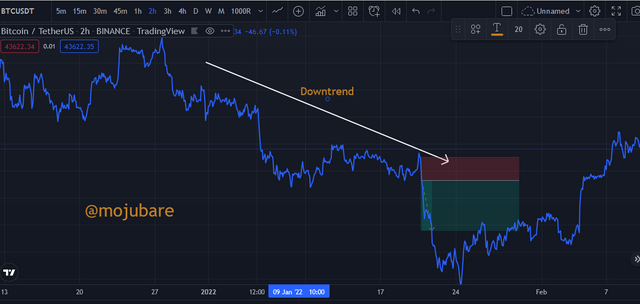
Prove your understanding of Bullish and Bearish Trading opportunities using Line charts. (Demonstrate with screenshots)
A perfect market is a complete make up of bullish and bearish occurrences, market occurrence is completely based on demand and supply. A trend line is a more clear representation of market performance over some time.
Trading is basically about buying and selling, either of a continuous buying or selling operations for a long time will give rise to a bearish or a bullish trend. A good trader needs to identify the opportunities presented by the bullish and bearish trends in order to accumulate profit.
Bullish trading opportunity
A bullish trend signifies to a trader to be a moment when purchase is to be made, a continuoes line presentation connecting series of higher-highs with lower-lows, is a representation of a bull market phase.
A bullish trend describes an upward movement in the market which is usually followed by an initial downtrend which indicates a good resistance point
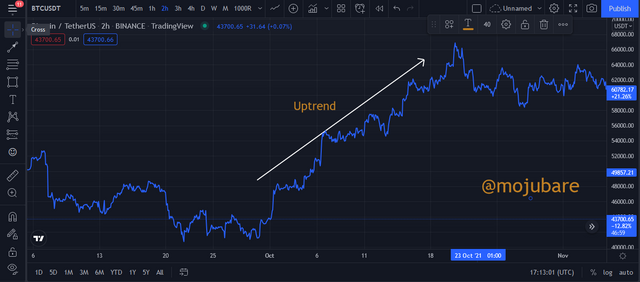
To trade a bullish opportunity, pick a buy trade after a support or during an accumulation period.
Bearish trending opportunity .
A bearish trend is a continuous representation of a price drop in the market which is always accompanied after an initial point of support. A bearish trend usually shows that more investors are getting interested in the market at the particular period and are buying into it the more.
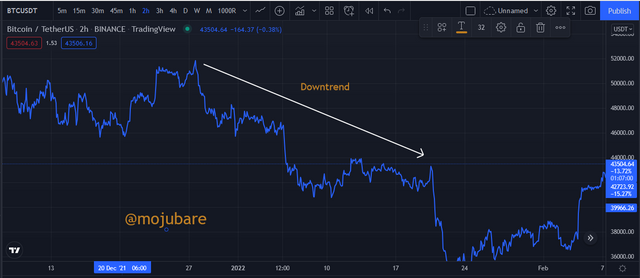
In trading a bearish opportunity, a sell order can be placed at a resistance which isn't voilated. When the price starts a downtrend, then a sell order can be placed.
Investigate the Advantages and Disadvantages of Line charts according to your knowledge.
Line charts is a simplified chart representation that describes the market, regardless of how simple and easy it is for traders to make use of line chart for their every day trade decisions, it still has it's some disadvantages too. Join me, while we explore some advantages and disadvantages of a line chart.
| Advantages | Disadvantages. |
|---|---|
| 1. It helps with the easy identification of change in a trade | It is best for only data based on total figures. |
| 2. It is used to join values | It has no defined/definite slope. |
| 3. I display relationship present between two variables | It becomes complicated when there are uneven class intervals. |
| 4. Displays trends and market change clearly | It becomes difficult to interpret when there is a lot of data imputed in the chart. |
| 5. It shows support and resistance point | It does not give us complete information. |
Conclusion
To conclude line chart is no doubt easy to interprete and trade since it removes all noise from the market but while it is a very good chart, it is important to emphasise that it shouldn't be traded alone but rather it should be properly analyzed through patterns and indicators. Trading without proper analysis and proper management of funds could be very disastrous causing the trader to part or all of their funds.